
Page 203 - Bruce Ellig - The Complete Guide to Executive Compensation (2007)
P. 203
Chapter 5. Salary 189
Compensation
(Thousands)
$400
TY LY
210
200
$100 $200
Sales Volume (Millions)
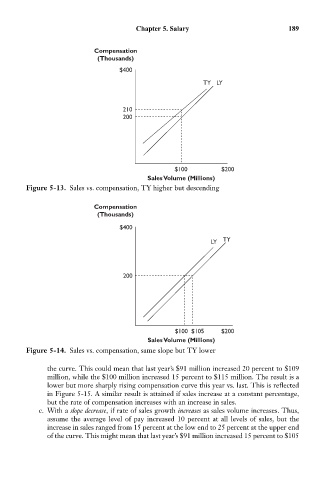
Figure 5-13. Sales vs. compensation, TY higher but descending
Compensation
(Thousands)
$400
TY
LY
200
$100 $105 $200
Sales Volume (Millions)
Figure 5-14. Sales vs. compensation, same slope but TY lower
the curve. This could mean that last year’s $91 million increased 20 percent to $109
million, while the $100 million increased 15 percent to $115 million. The result is a
lower but more sharply rising compensation curve this year vs. last. This is reflected
in Figure 5-15. A similar result is attained if sales increase at a constant percentage,
but the rate of compensation increases with an increase in sales.
c. With a slope decrease, if rate of sales growth increases as sales volume increases. Thus,
assume the average level of pay increased 10 percent at all levels of sales, but the
increase in sales ranged from 15 percent at the low end to 25 percent at the upper end
of the curve. This might mean that last year’s $91 million increased 15 percent to $105