
Page 199 - Bruce Ellig - The Complete Guide to Executive Compensation (2007)
P. 199
Chapter 5. Salary 185
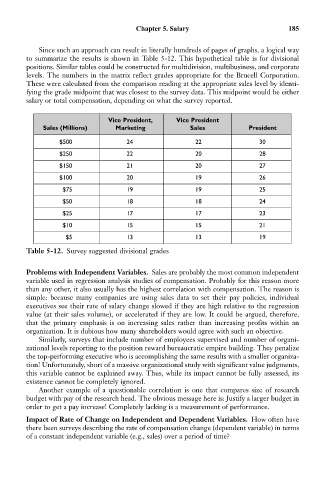
Since such an approach can result in literally hundreds of pages of graphs, a logical way
to summarize the results is shown in Table 5-12. This hypothetical table is for divisional
positions. Similar tables could be constructed for multidivision, multibusiness, and corporate
levels. The numbers in the matrix reflect grades appropriate for the Brucell Corporation.
These were calculated from the comparison reading at the appropriate sales level by identi-
fying the grade midpoint that was closest to the survey data. This midpoint would be either
salary or total compensation, depending on what the survey reported.
Vice President, Vice President
Sales (Millions) Marketing Sales President
$500 24 22 30
$250 22 20 28
$150 21 20 27
$100 20 19 26
$75 19 19 25
$50 18 18 24
$25 17 17 23
$10 15 15 21
$5 13 13 19
Table 5-12. Survey suggested divisional grades
Problems with Independent Variables. Sales are probably the most common independent
variable used in regression analysis studies of compensation. Probably for this reason more
than any other, it also usually has the highest correlation with compensation. The reason is
simple: because many companies are using sales data to set their pay policies, individual
executives see their rate of salary change slowed if they are high relative to the regression
value (at their sales volume), or accelerated if they are low. It could be argued, therefore,
that the primary emphasis is on increasing sales rather than increasing profits within an
organization. It is dubious how many shareholders would agree with such an objective.
Similarly, surveys that include number of employees supervised and number of organi-
zational levels reporting to the position reward bureaucratic empire building. They penalize
the top-performing executive who is accomplishing the same results with a smaller organiza-
tion! Unfortunately, short of a massive organizational study with significant value judgments,
this variable cannot be explained away. Thus, while its impact cannot be fully assessed, its
existence cannot be completely ignored.
Another example of a questionable correlation is one that compares size of research
budget with pay of the research head. The obvious message here is: Justify a larger budget in
order to get a pay increase! Completely lacking is a measurement of performance.
Impact of Rate of Change on Independent and Dependent Variables. How often have
there been surveys describing the rate of compensation change (dependent variable) in terms
of a constant independent variable (e.g., sales) over a period of time?