
Page 316 - Bruce Ellig - The Complete Guide to Executive Compensation (2007)
P. 316
302 The Complete Guide to Executive Compensation
conclusions drawn to resolve the differences. Each analysis is complicated because of various
levels of earnings, years of service, and retirement ages.
How Much Pension Is Needed? While it would be nice to receive a company retirement
benefit equal to last year’s pay or at least equal to after-tax income, it is unlikely for pension
planners to consider either seriously. Why not? There are several reasons. First, expenses
during retirement are less than while working. Among those expenses that end are business-
related expenses such as clothing, lunches, and transportation. In addition, payroll deductions
for pension plans and other benefit programs are eliminated. Admittedly, there may be postac-
tive expenses that need to be included, but the net effect most likely still results in a figure less
than 100 percent of final pay. Another reason for targeting less than final earnings is that social
security benefits will be paid to the retiree. However, because of the benefit level, social
security will be a more significant factor for lower-paid than executive-level employees.
It is important to determine the appropriate percentage of final pay that should be pro-
vided from the combined social security and employer pension plans. Since both short- and
long-term incentives are an increasing portion of total earnings as pay increases, it is not sur-
prising that the percentage of pay replaced by pensions declines as income increases. This is
because few pension plans consider long-term incentives in earnings estimates, although
many now consider short-term incentives. For example, if an executive earning $1 million in
salary, $2 million in annual incentives, and $4 million in long-term incentives targeted the
pension at 80 percent of final annual pay, this would be $2.4 million, or only 34 percent of
total pay. Not that many will shed a tear for the executive receiving “only” $2.4 million in an
annual pension. This simply demonstrates how the exclusion of long-term incentives can
dramatically affect the percentage of total pay replaced.
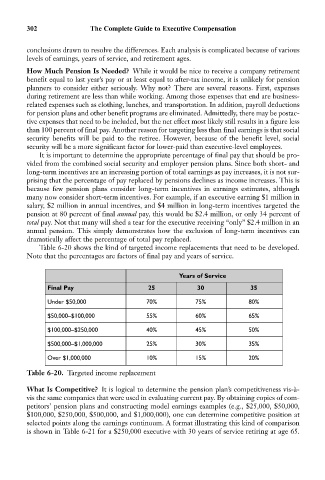
Table 6-20 shows the kind of targeted income replacements that need to be developed.
Note that the percentages are factors of final pay and years of service.
Years of Service
Final Pay 25 30 35
Under $50,000 70% 75% 80%
$50,000–$100,000 55% 60% 65%
$100,000–$250,000 40% 45% 50%
$500,000–$1,000,000 25% 30% 35%
Over $1,000,000 10% 15% 20%
Table 6-20. Targeted income replacement
What Is Competitive? It is logical to determine the pension plan’s competitiveness vis-à-
vis the same companies that were used in evaluating current pay. By obtaining copies of com-
petitors’ pension plans and constructing model earnings examples (e.g., $25,000, $50,000,
$100,000, $250,000, $500,000, and $1,000,000), one can determine competitive position at
selected points along the earnings continuum. A format illustrating this kind of comparison
is shown in Table 6-21 for a $250,000 executive with 30 years of service retiring at age 65.