
Page 318 - Bruce Ellig - The Complete Guide to Executive Compensation (2007)
P. 318
304 The Complete Guide to Executive Compensation
Defined
Years of Final
Company Benefit Contribution Total
Pay
C $972,000 $1,549,153 $2,521,153 10.1
F 1,079,531 1,311,011 2,390,542 9.6
I 831,382 1,410,516 2,214,898 9.0
A 1,054,646 1,127,490 2,182,136 8.7
E 1,042,079 1,083,016 2,125,095 8.5
Brucell 1,021,553 1,033,788 2,055,341 8.2
D 1,039,400 831,367 1,870,767 7.5
G 803,504 795,221 1,598,725 6.4
B 574,932 591,384 1,166,316 4.7
H 468,051 539,959 1,008,010 4.0
Averages 987,453 913,063 1,900,516 7.6
(excluding
Brucell)
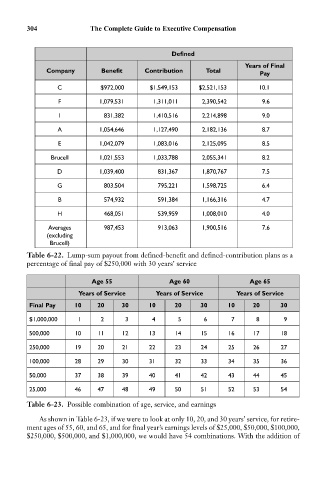
Table 6-22. Lump-sum payout from defined-benefit and defined-contribution plans as a
percentage of final pay of $250,000 with 30 years’ service
Age 55 Age 60 Age 65
Years of Service Years of Service Years of Service
Final Pay 10 20 30 10 20 30 10 20 30
$1,000,000 1 2 3 4 5 6 7 8 9
500,000 10 11 12 13 14 15 16 17 18
250,000 19 20 21 22 23 24 25 26 27
100,000 28 29 30 31 32 33 34 35 36
50,000 37 38 39 40 41 42 43 44 45
25,000 46 47 48 49 50 51 52 53 54
Table 6-23. Possible combination of age, service, and earnings
As shown in Table 6-23, if we were to look at only 10, 20, and 30 years’ service, for retire-
ment ages of 55, 60, and 65, and for final year’s earnings levels of $25,000, $50,000, $100,000,
$250,000, $500,000, and $1,000,000, we would have 54 combinations. With the addition of