
Page 317 - Bruce Ellig - The Complete Guide to Executive Compensation (2007)
P. 317
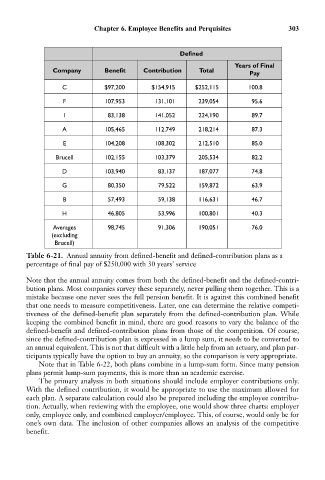
Chapter 6. Employee Benefits and Perquisites            303


                                                       Defined
                                                                       Years of Final
                   Company       Benefit    Contribution    Total
                                                                           Pay
                     C           $97,200       $154,915    $252,115        100.8

                      F          107,953        131,101     239,054        95.6
                      I           83,138        141,052     224,190        89.7

                     A           105,465        112,749     218,214        87.3
                     E           104,208        108,302     212,510        85.0

                   Brucell       102,155        103,379     205,534        82.2
                     D           103,940         83,137     187,077        74.8

                     G            80,350         79,522     159,872        63.9
                     B            57,493         59,138     116,631        46.7

                     H            46,805         53,996     100,801        40.3
                   Averages       98,745         91,306     190,051        76.0
                  (excluding
                   Brucell)
           Table 6-21. Annual annuity from defined-benefit and defined-contribution plans as a
           percentage of final pay of $250,000 with 30 years’ service
           Note that the annual annuity comes from both the defined-benefit and the defined-contri-
           bution plans. Most companies survey these separately, never pulling them together. This is a
           mistake because one never sees the full pension benefit. It is against this combined benefit
           that one needs to measure competitiveness. Later, one can determine the relative competi-
           tiveness of the defined-benefit plan separately from the defined-contribution plan. While
           keeping the combined benefit in mind, there are good reasons to vary the balance of the
           defined-benefit and defined-contribution plans from those of the competition. Of course,
           since the defined-contribution plan is expressed in a lump sum, it needs to be converted to
           an annual equivalent. This is not that difficult with a little help from an actuary, and plan par-
           ticipants typically have the option to buy an annuity, so the comparison is very appropriate.
               Note that in Table 6-22, both plans combine in a lump-sum form. Since many pension
           plans permit lump-sum payments, this is more than an academic exercise.
               The primary analysis in both situations should include employer contributions only.
           With the defined contribution, it would be appropriate to use the maximum allowed for
           each plan. A separate calculation could also be prepared including the employee contribu-
           tion. Actually, when reviewing with the employee, one would show three charts: employer
           only, employee only, and combined employer/employee. This, of course, would only be for
           one’s own data. The inclusion of other companies allows an analysis of the competitive
           benefit.