
Page 426 - Bruce Ellig - The Complete Guide to Executive Compensation (2007)
P. 426
412 The Complete Guide to Executive Compensation
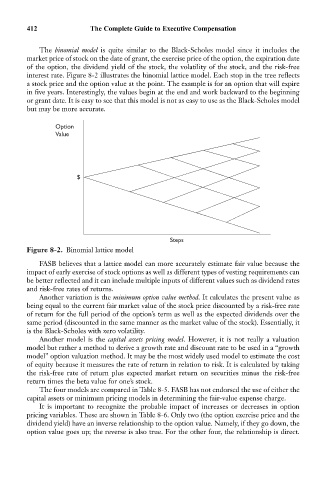
The binomial model is quite similar to the Black-Scholes model since it includes the
market price of stock on the date of grant, the exercise price of the option, the expiration date
of the option, the dividend yield of the stock, the volatility of the stock, and the risk-free
interest rate. Figure 8-2 illustrates the binomial lattice model. Each stop in the tree reflects
a stock price and the option value at the point. The example is for an option that will expire
in five years. Interestingly, the values begin at the end and work backward to the beginning
or grant date. It is easy to see that this model is not as easy to use as the Black-Scholes model
but may be more accurate.
Option
Value
$
Steps
Figure 8-2. Binomial lattice model
FASB believes that a lattice model can more accurately estimate fair value because the
impact of early exercise of stock options as well as different types of vesting requirements can
be better reflected and it can include multiple inputs of different values such as dividend rates
and risk-free rates of returns.
Another variation is the minimum option value method. It calculates the present value as
being equal to the current fair market value of the stock price discounted by a risk-free rate
of return for the full period of the option’s term as well as the expected dividends over the
same period (discounted in the same manner as the market value of the stock). Essentially, it
is the Black-Scholes with zero volatility.
Another model is the capital assets pricing model. However, it is not really a valuation
model but rather a method to derive a growth rate and discount rate to be used in a “growth
model” option valuation method. It may be the most widely used model to estimate the cost
of equity because it measures the rate of return in relation to risk. It is calculated by taking
the risk-free rate of return plus expected market return on securities minus the risk-free
return times the beta value for one’s stock.
The four models are compared in Table 8-5. FASB has not endorsed the use of either the
capital assets or minimum pricing models in determining the fair-value expense charge.
It is important to recognize the probable impact of increases or decreases in option
pricing variables. These are shown in Table 8-6. Only two (the option exercise price and the
dividend yield) have an inverse relationship to the option value. Namely, if they go down, the
option value goes up; the reverse is also true. For the other four, the relationship is direct.