
Page 618 - Bruce Ellig - The Complete Guide to Executive Compensation (2007)
P. 618
604 The Complete Guide to Executive Compensation
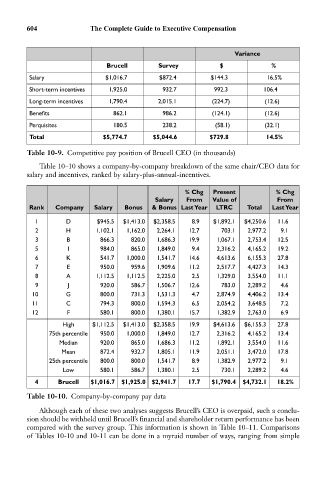
Variance
Brucell Survey $ %
Salary $1,016.7 $872.4 $144.3 16.5%
Short-term incentives 1,925.0 932.7 992.3 106.4
Long-term incentives 1,790.4 2,015.1 (224.7) (12.6)
Benefits 862.1 986.2 (124.1) (12.6)
Perquisites 180.5 238.2 (58.1) (32.1)
Total $5,774.7 $5,044.6 $729.8 14.5%
Table 10-9. Competitive pay position of Brucell CEO (in thousands)
Table 10–10 shows a company-by-company breakdown of the same chair/CEO data for
salary and incentives, ranked by salary-plus-annual-incentives.
% Chg Present % Chg
Salary From Value of From
Rank Company Salary Bonus & Bonus Last Year LTRC Total Last Year
1 D $945.5 $1,413.0 $2,358.5 8.9 $1,892.1 $4,250.6 11.6
2 H 1,102.1 1,162.0 2,264.1 12.7 703.1 2,977.2 9.1
3 B 866.3 820.0 1,686.3 19.9 1,067.1 2,753.4 12.5
5 I 984.0 865.0 1,849.0 9.4 2,316.2 4,165.2 19.2
6 K 541.7 1,000.0 1,541.7 14.6 4,613.6 6,155.3 27.8
7 E 950.0 959.6 1,909.6 11.2 2,517.7 4,427.3 14.3
8 A 1,112.5 1,112.5 2,225.0 2.5 1,329.0 3,554.0 11.1
9 J 920.0 586.7 1,506.7 12.6 783.0 2,289.2 4.6
10 G 800.0 731.3 1,531.3 4.7 2,874.9 4,406.2 13.4
11 C 794.3 800.0 1,594.3 6.5 2,054.2 3,648.5 7.2
12 F 580.1 800.0 1,380.1 15.7 1,382.9 2,763.0 6.9
High $1,112.5 $1,413.0 $2,358.5 19.9 $4,613.6 $6,155.3 27.8
75th percentile 950.0 1,000.0 1,849.0 12.7 2,316.2 4,165.2 13.4
Median 920.0 865.0 1,686.3 11.2 1,892.1 3,554.0 11.6
Mean 872.4 932.7 1,805.1 11.9 2,051.1 3,472.0 17.8
25th percentile 800.0 800.0 1,541.7 8.9 1,382.9 2,977.2 9.1
Low 580.1 586.7 1,380.1 2.5 730.1 2,289.2 4.6
4 Brucell $1,016.7 $1,925.0 $2,941.7 17.7 $1,790.4 $4,732.1 18.2%
Table 10-10. Company-by-company pay data
Although each of these two analyses suggests Brucell’s CEO is overpaid, such a conclu-
sion should be withheld until Brucell’s financial and shareholder return performance has been
compared with the survey group. This information is shown in Table 10–11. Comparisons
of Tables 10-10 and 10-11 can be done in a myraid number of ways, ranging from simple