
Page 256 - The extraordinary leader
P. 256
Developing Leadership Teams • 233
100
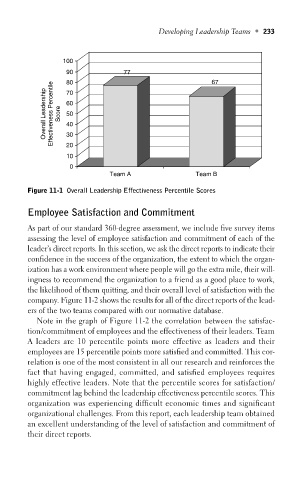
90 77 67
80
Overall Leadership Effectiveness Percentile Score 70
60
50
40
30
20
10
0
Team A Team B
Figure 11-1 Overall Leadership Effectiveness Percentile Scores
Employee Satisfaction and Commitment
As part of our standard 360-degree assessment, we include five survey items
assessing the level of employee satisfaction and commitment of each of the
leader’s direct reports. In this section, we ask the direct reports to indicate their
confidence in the success of the organization, the extent to which the organ-
ization has a work environment where people will go the extra mile, their will-
ingness to recommend the organization to a friend as a good place to work,
the likelihood of them quitting, and their overall level of satisfaction with the
company. Figure 11-2 shows the results for all of the direct reports of the lead-
ers of the two teams compared with our normative database.
Note in the graph of Figure 11-2 the correlation between the satisfac-
tion/commitment of employees and the effectiveness of their leaders. Team
A leaders are 10 percentile points more effective as leaders and their
employees are 15 percentile points more satisfied and committed. This cor-
relation is one of the most consistent in all our research and reinforces the
fact that having engaged, committed, and satisfied employees requires
highly effective leaders. Note that the percentile scores for satisfaction/
commitment lag behind the leadership effectiveness percentile scores. This
organization was experiencing difficult economic times and significant
organizational challenges. From this report, each leadership team obtained
an excellent understanding of the level of satisfaction and commitment of
their direct reports.