
Page 257 - The extraordinary leader
P. 257
234 • The Extraordinary Leader
100
90 65
80
Employee Satisfaction / Commitment Percentile Score 70 50
60
50
40
30
20
10
0
Team A Team B
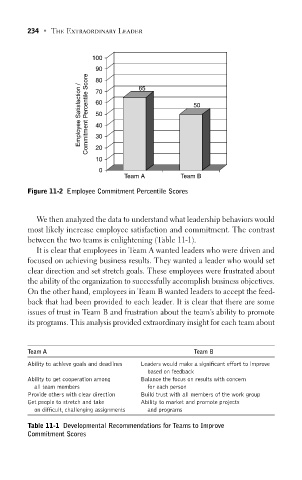
Figure 11-2 Employee Commitment Percentile Scores
We then analyzed the data to understand what leadership behaviors would
most likely increase employee satisfaction and commitment. The contrast
between the two teams is enlightening (Table 11-1).
It is clear that employees in Team A wanted leaders who were driven and
focused on achieving business results. They wanted a leader who would set
clear direction and set stretch goals. These employees were frustrated about
the ability of the organization to successfully accomplish business objectives.
On the other hand, employees in Team B wanted leaders to accept the feed-
back that had been provided to each leader. It is clear that there are some
issues of trust in Team B and frustration about the team’s ability to promote
its programs. This analysis provided extraordinary insight for each team about
Team A Team B
Ability to achieve goals and deadlines Leaders would make a significant effort to improve
based on feedback
Ability to get cooperation among Balance the focus on results with concern
all team members for each person
Provide others with clear direction Build trust with all members of the work group
Get people to stretch and take Ability to market and promote projects
on difficult, challenging assignments and programs
Table 11-1 Developmental Recommendations for Teams to Improve
Commitment Scores