
Page 232 - The Green Building Bottom Line The Real Cost of Sustainable Building
P. 232
210 CHAPTER 7
2 As discussed in Chapter 4, putting an actual dollar figure on branding value is noto-
riously difficult. It’s best to focus on more tangible values, such as reduced operat-
ing expenses and enhanced productivity and, at best, simply know that in various
unpredictably surprising ways, your company’s reputation is enhanced by taking a
more sustainable orientation.
My colleagues and I at Melaver, Inc. believe business in general is moving to
embrace sustainable tenets, to the point where a company’s reputation can be nega-
tively affected by not embracing a sustainable ethos. With this mindset, the question
becomes the extent to which a company can afford not to get on the bandwagon. If, in
an s-shaped diffusion curve, the early innovators have the marketing advantage that
comes with being a first-mover, then the fast-followers need to hasten their activities
toward sustainability less they face a potential negative backlash. Some may be aware
of the huge wave of negative publicity Shell Oil faced over its initial (and then
rescinded) decision to scuttle its Brent Spar oil platform in the North Sea. Or the atten-
tion Nike has received over its contract labor practices in the developing world. Or
the obesity lawsuit McDonald’s faced in the United Kingdom. Granted, these are well-
Y Years 0 1 2 3 4
ears
REVENUES/SA
VINGS
REVENUES/SAVINGS
ect
Savings
DirDirect Savings
Energy & Water 110,500 110,500 110,500 110,500
10,500
10,500
ater
&
Energy
10,500
10,500
56,100
56,100
56,100
ar
56,100
ea
Common area maintenancemaintenance 56,100 56,100 56,100 56,100
Common
IndirIndirect Savings
ect
Savings
Reduced absenteeism
Reduced absenteeism 170,000 170,000 170,000 170,000
170,000
170,000
170,000
170,000
Reduced turnover: staff
Reduced turnover: staff 143,250 143,250 143,250 143,250
143,250
143,250
143,250
143,250
worker
good
turnover:
78,750
Reduced turnover: good worker 78,750 78,750 78,750 78,750
Reduced
78,750
78,750
78,750
72,100
72,100
Hiring of new personnel 72,100 72,100 72,100 72,100
72,100
Hiring of new personnel
72,100
r
ect
evenue
DirDirect revenue enhancement
enhancement
1,275,000
1,275,000
1,275,000
1,275,000
oductivity
oved
Improved productivity 1,275,000 1,275,000 1,275,000 1,275,000
pr
Impr
r
evenue
enhancement
ect
IndirIndirect revenue enhancement
Branding value
Branding
value
Revenues
Subtotal
Subtotal Revenues
COSTS
COSTS
(4,760,000)
Rent
(4,760,000)
(4,760,000)
(4,760,000)
Rent (4,760,000) (4,760,000) (4,760,000) (4,760,000)
(2,854,300)
(2,854,300)
(2,854,300)
Total Cashflowotal Cashflow 0 (2,854,300) (2,854,300) (2,854,300) (2,854,300)
(2,854,300)
0.751
0.826
0.909
Discount Factor
Discount Factor 1.000 0.909 0.826 0.751 0.683
0.683
1.000
(1,949,525)
PV CashflowCashflow
PV 0 (2,594,818) (2,358,926) (2,144,478) (1,949,525)
(2,144,478)
(2,358,926)
(2,594,818)
NPV
NPV (17,538,438)
(17,538,438)
Savings
of
Rent
Annual
as
36.57%
%
Savings as % of Annual Rent 36.57%
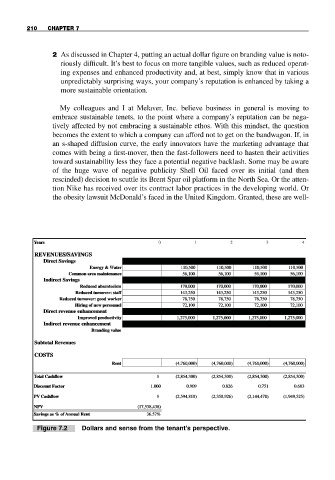
Figure 7.2 Dollars and sense from the tenant’s perspective.