Page 274 - The Green Building Bottom Line The Real Cost of Sustainable Building
P. 274

252  CHAPTER 8


                     widely held belief that, whereas today green buildings are a differentiator, tomorrow
                     they will be the new standard. Everyone will be building to LEED standards. We hope
                     so. If you take serious stock of the various reports emanating from the Intergovern-
                     mental Panel on Climate Change, you quickly begin to realize that if we all don’t get
                     on board quickly with a new way of doing business, there will be a lot less business
                     for all of us to do.
                       A sustainable brokerage business such as ours is then faced with an interesting
                     challenge: Do we try to be proprietary about what we know (whatever that is) in the
                     hope of extending the time period of our competitive advantage and thus enhanc-
                     ing our revenue stream? Or do we share what we know with anyone who will lis-
                     ten, in the hope that this green movement will ratchet up all the more quickly but
                     with the recognition that our own time frame of superior profitability will be cut
                     short?
                       It’s an interesting quandary, but at the end of the day it’s a false choice. From a
                     purely pragmatic point of view, the movement toward sustainability is happening so
                     quickly that our own particular response to it can only be open sharing of what we
                     know. If we were to be proprietary about what we know and do (we’re not sure what
                     that is, but no matter), we don’t think it would slow down this green movement one
                     iota. But being active, positive, and collaborative participants in this movement does
                     help move the ball forward. We are doing what we can in our own backyard, which
                     leads us to the more idealistic point of view.


              Y Years                                          0         1         2       3
               ears
              REVENUES/SAVINGS
              REVENUES/SA VINGS
                                                                     300,000
                                                                               300,000
                                                                                       300,000
                                                 okers
                                         evenues
                                      Net
                                      Net rrevenues from brokers     300,000   300,000  300,000
                                                br
                                              om
                                             fr
                                                                               300,000
                                                                                       300,000
              Total Revenuesotal Revenues                            300,000   300,000  300,000
                                                                     300,000
              EXPENSES
              EXPENSES
                                                                               (60,000)
                                               Personnel
                                               Personnel             (60,000)  (60,000)  (60,000)
                                                                                        (60,000)
                                                                     (60,000)
                                                  Rent               (50,000)  (50,000)  (50,000)
                                                  Rent
                                                                     (50,000)
                                                                                        (50,000)
                                                                               (50,000)
                                                                                        (20,000)
                                       Administrative expenses       (20,000)  (20,000)  (20,000)
                                       Administrative
                                                expenses
                                                                               (20,000)
                                                                     (20,000)
                                                                              (130,000)
                                                                    (130,000)
              Total Expensesotal Expenses                           (130,000)  (130,000)  (130,000)
                                                                                       (130,000)
                                                                                       170,000
                                                                               170,000
                                                                     170,000
              Total Cashflowotal Cashflow                     0      170,000   170,000  170,000
                                                                                0.826
              Discount Factor                               1.000     0.909     0.826    0.751
                                                                                         0.751
                   Factor
              Discount
                                                            1.000
                                                                      0.909
                                                                     154,545
                                                                                       127,724
              PV Cashflow
                                                                               140,496
              PV Cashflow                                     0      154,545   140,496  127,724
              NPV
                                                          1,044,576
              NPV                                         1,044,576
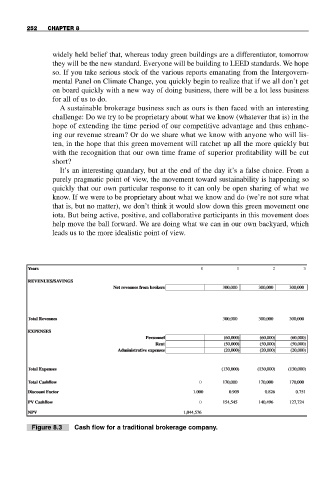
               Figure 8.3  Cash flow for a traditional brokerage company.
   269   270   271   272   273   274   275   276   277   278   279