
Page 277 - The Green Building Bottom Line The Real Cost of Sustainable Building
P. 277
SUSTAINABLE BROKERAGE 255
4 4 5 6 7 8 9 10 OT ALS
10 TOTALS
300,000
3,000,000
300,000
300,000
300,000
300,000
300,000
300,000 300,000 300,000 300,000 300,000 300,000 300,000 3,000,000
300,000
75,000
75,000
75,000 75,000 75,000 75,000 75,000 375,000
75,000
75,000
375,000
75,000
750,000
12,500
187,500
225,000
75,000 112,500 150,000 187,500 225,000 750,000
75,000
150,000
525,000
300,000
600,000
562,500
300,000
300,000 300,000 450,000 487,500 525,000 562,500 600,000 4,125,000
4,125,000
450,000
487,500
(60,000)
(60,000)
(60,000)
(60,000)
(600,000)
(60,000)
(60,000) (60,000) (60,000) (60,000) (60,000) (60,000) (60,000) (600,000)
(60,000)
(60,000)
(50,000)
(50,000)
(50,000)
(50,000)
(50,000)
(50,000)
(500,000)
(50,000)
(50,000) (50,000) (50,000) (50,000) (50,000) (50,000) (50,000) (500,000)
(20,000)
(200,000)
(20,000)
(20,000)
(20,000)
(20,000)
(20,000)
(20,000) (20,000) (20,000) (20,000) (20,000) (20,000) (20,000) (200,000)
(20,000)
(60,000)
(60,000)
(60,000)
(60,000) (60,000) (60,000) (60,000) (60,000) (300,000)
(60,000)
(60,000)
(300,000)
(7,500)
(7,500)
(37,500)
(7,500)
(7,500)
(7,500) (7,500) (7,500) (7,500) (7,500) (37,500)
(7,500)
(7,500) (1 (11,250)1,250) (15,000) (18,750) (22,500) (75,000)
(22,500)
(18,750)
(7,500)
(15,000)
(75,000)
(130,000) (130,000) (205,000) (208,750) (212,500) (216,250) (220,000) (1,637,500)
(130,000)
(220,000)
(216,250)
(130,000)
(212,500)
(208,750)
(205,000)
(1,637,500)
245,000
346,250
170,000
312,500
278,750
380,000
170,000 170,000 245,000 278,750 312,500 346,250 380,000
170,000
0.424
0.386
0.683 0.621 0.564 0.513 0.467 0.424 0.386
0.564
0.621
0.513
0.683
0.467
116,11212 105,557 138,296 143,043 145,784 146,844 146,506
146,506
16,1
143,043
145,784
146,844
138,296
105,557
Given the current status of referrals coming from Melaver | Mouchet to Melaver, Inc.,
we feel these revenue assumptions are reasonable to conservative.
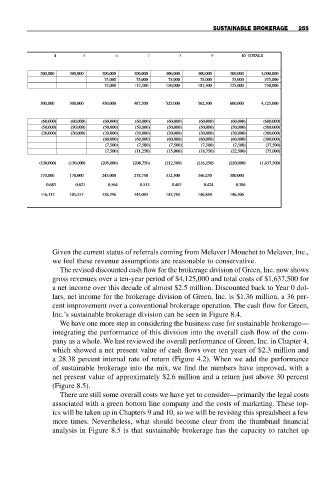
The revised discounted cash flow for the brokerage division of Green, Inc. now shows
gross revenues over a ten-year period of $4,125,000 and total costs of $1,637,500 for
a net income over this decade of almost $2.5 million. Discounted back to Year 0 dol-
lars, net income for the brokerage division of Green, Inc. is $1.36 million, a 36 per-
cent improvement over a conventional brokerage operation. The cash flow for Green,
Inc.’s sustainable brokerage division can be seen in Figure 8.4.
We have one more step in considering the business case for sustainable brokerage—
integrating the performance of this division into the overall cash flow of the com-
pany as a whole. We last reviewed the overall performance of Green, Inc. in Chapter 4,
which showed a net present value of cash flows over ten years of $2.3 million and
a 28.38 percent internal rate of return (Figure 4.2). When we add the performance
of sustainable brokerage into the mix, we find the numbers have improved, with a
net present value of approximately $2.6 million and a return just above 30 percent
(Figure 8.5).
There are still some overall costs we have yet to consider—primarily the legal costs
associated with a green bottom line company and the costs of marketing. These top-
ics will be taken up in Chapters 9 and 10, so we will be revising this spreadsheet a few
more times. Nevertheless, what should become clear from the thumbnail financial
analysis in Figure 8.5 is that sustainable brokerage has the capacity to ratchet up