
Page 352 - The Green Building Bottom Line The Real Cost of Sustainable Building
P. 352
2,000
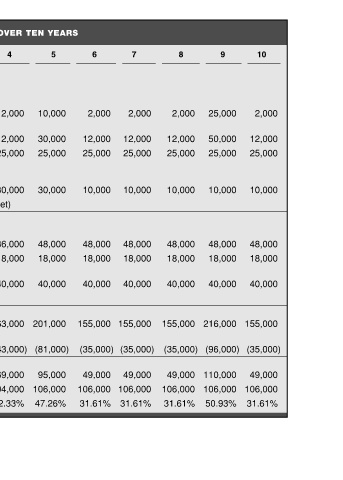
10 12,000 25,000 10,000 48,000 18,000 40,000 155,000 (35,000) 49,000 106,000 31.61%
25,000 25,000 48,000 40,000 216,000 110,000 106,000 50.93%
9 50,000 10,000 18,000 (96,000)
2,000
8 12,000 25,000 10,000 48,000 18,000 40,000 155,000 (35,000) 49,000 106,000 31.61%
2,000 12,000 25,000 10,000 48,000 18,000 40,000 (35,000) 49,000
7 155,000 106,000 31.61%
2,000 (35,000)
6 12,000 25,000 10,000 48,000 18,000 40,000 155,000 49,000 106,000 31.61%
GREEN, INC.’S COMMUNICATIONS SPEND OVER TEN YEARS
10,000 30,000 25,000 30,000 48,000 18,000 40,000 201,000 95,000 106,000 47.26%
5 (81,000)
2,000
4 12,000 25,000 30,000 36,000 18,000 40,000 163,000 (43,000) 69,000 94,000 42.33%
3 2,000 12,000 25,000 30,000 24,000 18,000 30,000 141,000 (21,000) 69,000 72,000 48.94%
2,000
2 12,000 25,000 30,000 18,000 20,000 107,000 13,000 69,000 38,000 64.49%
1 10,000 20,000 50,000 30,000 Project-specific marketing (budgeted as % of development budget) 110,000 10,000 110,000 0 100.00%
Annual marketing spend Internal branding (retreat) Collateral (cards, photo- graphs, brochures) Web development and Advertising, general Cause-related marketing (including pro bono Annual public relations spend Speakers bureau and article Speakers bureau travel and Educational tours of projects Total communications spend Communications spend
TABLE 10.1 YEARS maintenance consulting) placements Internet headlining expenses annually annually
329