
Page 353 - The Green Building Bottom Line The Real Cost of Sustainable Building
P. 353
330 CHAPTER 10
ears
Y Years 0 1 2 3
REVENUES
REVENUES
21,300
Shaping values, chapter 21,300 21,300 21,300
21,300
21,300
Shaping values, chapter 11
cultur
eating
fg
79,000
chapter
Creating a culture of green glue, chapter 22 79,000 79,000 79,000
79,000
glue,
eo
een
r
Cr
79,000
a
om
out,
inside
chapter
een
fr
3,300
3,300
3,300
Green from the inside out, chapter 33 3,300 3,300 3,300
the
Gr
Developing expertise in LEED, chapter 0 0 0
Developing expertise in LEED, chapter 44
okerage,
Sustainable
br
Sustainable brokerage, chapterchapter 8 8 0 0 0
marketing,
chapter
Gr
Green marketing, chapter 1010
een
Sale of Gr een, Inc.
Sale of Green, Inc.
103,600
103,600
103,600
Total Revenuesotal Revenues 103,600 103,600 103,600
EXPENSES
EXPENSES
Shaping values, chapter 11 (166,000) (1 (114,500) (91,875) (97,286)
Shaping
(166,000)
chapter
14,500)
(97,286)
(91,875)
values,
(57,600)
(64,631)
Cr eating a cultur eo fg r een glue, chapter 0 (57,600) (64,631) (72,717)
(72,717)
Creating a culture of green glue, chapter 22
(22,998)
(22,381)
the
chapter
om
out,
(78,490)
fr
inside
Green from the inside out, chapter 33 0 (78,490) (22,381) (22,998)
een
Gr
in
LEED,
expertise
Developing
(890,000)
Developing expertise in LEED, chapter 44 (49,000) (150,000) (417,000) (890,000)
(49,000)
(150,000)
(417,000)
chapter
Sustainable brokerage, chapterchapter 8 8 0 0 0 0
br
Sustainable
okerage,
(35,800)
for
(35,800)
Overmarket costs for marketing, chapter 1010 (35,800) (35,800) (35,800)
Overmarket
marketing,
(35,800)
chapter
costs
(215,000)
(436,390)
(631,688)
(1,118,802)
Total Expensesotal Expenses (215,000) (436,390) (631,688) (1,1 18,802)
(215,000)
(1,015,202)
Total Cashflowotal Cashflow (215,000) (332,790) (528,088) (1,015,202)
(332,790)
(528,088)
Discount Factor 1.00 0.91 0.83 0.75
0.75
Discount Factor
0.83
0.91
1.00
PV CashflowCashflow
PV (215,000) (302,536) (436,436) (762,736)
(302,536)
(436,436)
(215,000)
(762,736)
NPV
NPV 2,401,349
2,401,349
IRR
IRR 27.94%
27.94%
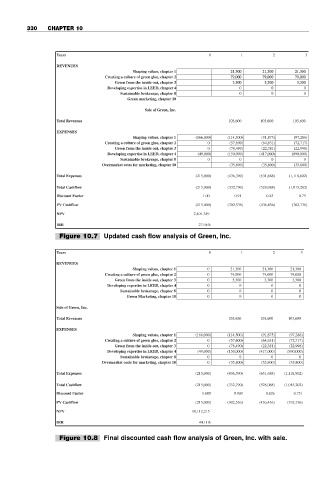
Figure 10.7 Updated cash flow analysis of Green, Inc.
Y Yearsears 0 1 2 3
REVENUES
REVENUES
values,
Shaping
chapter
21,300
21,300
Shaping values, chapter 11 0 21,300 21,300 21,300
21,300
glue,
a
79,000
een
eating
r
chapter
Creating a culture of green glue, chapter 22 0 79,000 79,000 79,000
eo
fg
cultur
Cr
79,000
79,000
3,300
fr
chapter
3,300
een
the
Gr
inside
Green from the inside out, chapter 33 0 3,300 3,300 3,300
om
3,300
out,
Developing expertise in LEED, chapter 44 0 0 0 0
Developing
expertise
in
chapter
LEED,
Sustainable brokerage, chapterchapter 8
Sustainable br okerage, 8 0 0 0 0
Marketing,
Green Marketing, chapter 1010 0 0 0 0
chapter
een
Gr
een,
Sale
Inc.
of
Gr
Sale of Green, Inc.
103,600
103,600
103,600
Total Revenuesotal Revenues 103,600 103,600 103,600
EXPENSES
EXPENSES
14,500)
chapter
(166,000)
Shaping values, chapter 11 (166,000) (1 (114,500) (91,875) (97,286)
values,
(97,286)
Shaping
(91,875)
Creating a culture of green glue, chapter 22
(64,631)
(72,717)
Cr eating a cultur eo fg r een glue, chapter 0 (57,600) (64,631) (72,717)
(57,600)
Green from the inside out, chapter 33 0 (78,490) (22,381) (22,998)
om
een
fr
out,
(22,998)
inside
(22,381)
the
Gr
chapter
(78,490)
(49,000)
(890,000)
Developing expertise in LEED, chapter (49,000) (150,000) (417,000) (890,000)
Developing expertise in LEED, chapter 44
(150,000)
(417,000)
Sustainable br okerage, 8 0 0 0 0
Sustainable brokerage, chapterchapter 8
(35,800)
marketing,
Overmarket
for
costs
(35,800)
Overmarket costs for marketing, chapterchapter 1010 0 (35,800) (35,800) (35,800)
(35,800)
(1,118,802)
Total Expensesotal Expenses (215,000) (436,390) (631,688) (1,1 18,802)
(436,390)
(215,000)
(631,688)
(1,015,202)
(215,000)
(528,088)
Total Cashflowotal Cashflow (215,000) (332,790) (528,088) (1,015,202)
(332,790)
0.751
Discount Factor 1.000 0.909 0.826 0.751
Discount
1.000
0.909
0.826
Factor
(215,000)
PV CashflowCashflow
PV (215,000) (302,536) (436,436) (762,736)
(302,536)
(436,436)
(762,736)
NPV 10,112,215
NPV
12,215
10,1
IRR
IRR 44.11%
44.1
1%
Figure 10.8 Final discounted cash flow analysis of Green, Inc. with sale.