
Page 169 - The Handbook for Quality Management a Complete Guide to Operational Excellence
P. 169
156 P r o c e s s C o n t r o l Q u a n t i f y i n g P r o c e s s Va r i a t i o n 157
Sample
Statistic Description Equation/Symbol
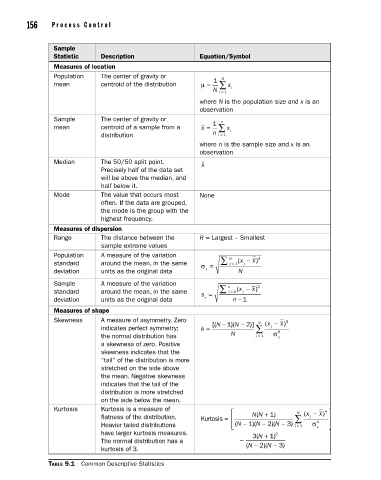
Measures of location
Population The center of gravity or N
1
mean centroid of the distribution µ = ∑ x i
N i = 1
where N is the population size and x is an
observation
Sample The center of gravity or n
1
mean centroid of a sample from a x = ∑ x i
distribution n i = 1
where n is the sample size and x is an
observation
Median The 50/50 split point. � x
Precisely half of the data set
will be above the median, and
half below it.
Mode The value that occurs most None
often. If the data are grouped,
the mode is the group with the
highest frequency.
Measures of dispersion
Range The distance between the R = Largest – Smallest
sample extreme values
Population A measure of the variation N 2
x
standard around the mean, in the same σ = ∑ j = 1 ( x − )
j
deviation units as the original data x N
Sample A measure of the variation n 2
x
standard around the mean, in the same s = ∑ j = 1 ( x − )
j
deviation units as the original data x n − 1
Measures of shape
Skewness A measure of asymmetry. Zero N ( x − x) 3
indicates perfect symmetry; k = [( N − )(1 N − )]2 ∑ j 3
the normal distribution has N j = 1 σ x
a skewness of zero. Positive
skewness indicates that the
“tail” of the distribution is more
stretched on the side above
the mean. Negative skewness
indicates that the tail of the
distribution is more stretched
on the side below the mean.
Kurtosis Kurtosis is a measure of N N − x)
4
(
flatness of the distribution. Kurtosis = N N + ) 1 ∑ x ( j
1
2
Heavier tailed distributions N ( − )( N − )( N − ) 3 j = 1 σ 4 x
have larger kurtosis measures. 3( N + 1) 2
The normal distribution has a −
kurtosis of 3. ( N − 2)( N − 3)
Table 9.1 Common Descriptive Statistics
09_Pyzdek_Ch09_p151-208.indd 156 11/21/12 1:41 AM