
Page 170 - The Handbook for Quality Management a Complete Guide to Operational Excellence
P. 170
156 P r o c e s s C o n t r o l Q u a n t i f y i n g P r o c e s s Va r i a t i o n 157
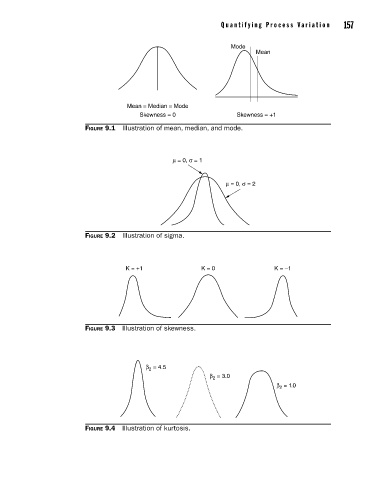
Mode
Mean
Mean = Median = Mode
Skewness = 0 Skewness = +1
Figure 9.1 Illustration of mean, median, and mode.
µ = 0, σ = 1
µ = 0, σ = 2
Figure 9.2 Illustration of sigma.
K = +1 K = 0 K = –1
Figure 9.3 Illustration of skewness.
β = 4.5
2
β 2 = 3.0
β = 1.0
2
Figure 9.4 Illustration of kurtosis.
09_Pyzdek_Ch09_p151-208.indd 157 11/21/12 1:42 AM