
Page 175 - The Handbook for Quality Management a Complete Guide to Operational Excellence
P. 175
162 P r o c e s s C o n t r o l Q u a n t i f y i n g P r o c e s s Va r i a t i o n 163
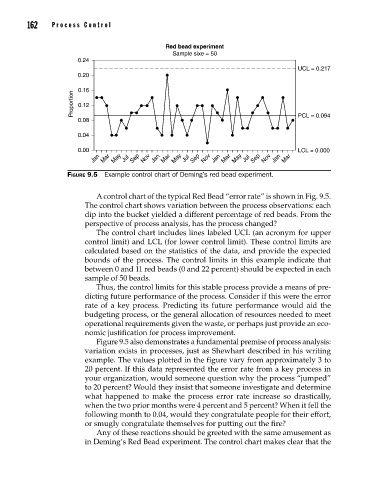
Red bead experiment
Sample sixe = 50
0.24
UCL = 0.217
0.20
0.16
Proportion 0.12
0.08 PCL = 0.094
0.04
0.00 LCL = 0.000
Jan Mar May Jul Sep Nov Jan Mar May Jul Sep Nov Jan Mar May Jul Sep Nov Jan Mar
Figure 9.5 Example control chart of Deming’s red bead experiment.
A control chart of the typical Red Bead “error rate” is shown in Fig. 9.5.
The control chart shows variation between the process observations: each
dip into the bucket yielded a different percentage of red beads. From the
perspective of process analysis, has the process changed?
The control chart includes lines labeled UCL (an acronym for upper
control limit) and LCL (for lower control limit). These control limits are
calculated based on the statistics of the data, and provide the expected
bounds of the process. The control limits in this example indicate that
between 0 and 11 red beads (0 and 22 percent) should be expected in each
sample of 50 beads.
Thus, the control limits for this stable process provide a means of pre-
dicting future performance of the process. Consider if this were the error
rate of a key process. Predicting its future performance would aid the
budgeting process, or the general allocation of resources needed to meet
operational requirements given the waste, or perhaps just provide an eco-
nomic justification for process improvement.
Figure 9.5 also demonstrates a fundamental premise of process analysis:
variation exists in processes, just as Shewhart described in his writing
example. The values plotted in the figure vary from approximately 3 to
20 percent. If this data represented the error rate from a key process in
your organization, would someone question why the process “jumped”
to 20 percent? Would they insist that someone investigate and determine
what happened to make the process error rate increase so drastically,
when the two prior months were 4 percent and 5 percent? When it fell the
following month to 0.04, would they congratulate people for their effort,
or smugly congratulate themselves for putting out the fire?
Any of these reactions should be greeted with the same amusement as
in Deming’s Red Bead experiment. The control chart makes clear that the
09_Pyzdek_Ch09_p151-208.indd 162 11/21/12 1:42 AM