
Page 179 - The Handbook for Quality Management a Complete Guide to Operational Excellence
P. 179
166 P r o c e s s C o n t r o l Q u a n t i f y i n g P r o c e s s Va r i a t i o n 167
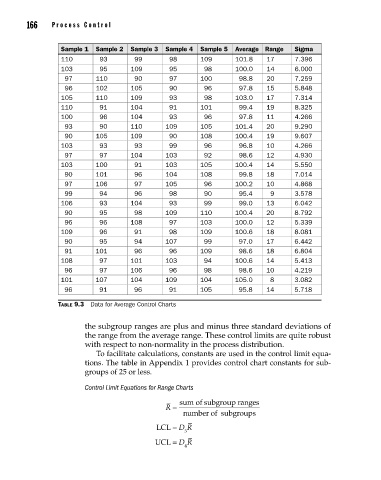
Sample 1 Sample 2 Sample 3 Sample 4 Sample 5 Average Range Sigma
110 93 99 98 109 101.8 17 7.396
103 95 109 95 98 100.0 14 6.000
97 110 90 97 100 98.8 20 7.259
96 102 105 90 96 97.8 15 5.848
105 110 109 93 98 103.0 17 7.314
110 91 104 91 101 99.4 19 8.325
100 96 104 93 96 97.8 11 4.266
93 90 110 109 105 101.4 20 9.290
90 105 109 90 108 100.4 19 9.607
103 93 93 99 96 96.8 10 4.266
97 97 104 103 92 98.6 12 4.930
103 100 91 103 105 100.4 14 5.550
90 101 96 104 108 99.8 18 7.014
97 106 97 105 96 100.2 10 4.868
99 94 96 98 90 95.4 9 3.578
106 93 104 93 99 99.0 13 6.042
90 95 98 109 110 100.4 20 8.792
96 96 108 97 103 100.0 12 5.339
109 96 91 98 109 100.6 18 8.081
90 95 94 107 99 97.0 17 6.442
91 101 96 96 109 98.6 18 6.804
108 97 101 103 94 100.6 14 5.413
96 97 106 96 98 98.6 10 4.219
101 107 104 109 104 105.0 8 3.082
96 91 96 91 105 95.8 14 5.718
Table 9.3 Data for Average Control Charts
the subgroup ranges are plus and minus three standard deviations of
the range from the average range. These control limits are quite robust
with respect to non-normality in the process distribution.
To facilitate calculations, constants are used in the control limit equa-
tions. The table in Appendix 1 provides control chart constants for sub-
groups of 25 or less.
Control Limit Equations for Range Charts
sum of subgroup ranges
R =
s
number of subgroups
LCL = D R
3
UCL = D R
4
09_Pyzdek_Ch09_p151-208.indd 166 11/21/12 1:42 AM