Page 183 - The Handbook for Quality Management a Complete Guide to Operational Excellence
P. 183

170    P r o c e s s   C o n t r o l                                                                                                                           Q u a n t i f y i n g   P r o c e s s   Va r i a t i o n    171


                                Control Limit Equations for Averages Charts Based on S-Bar
                                                         sum of subgroup averages
                                                     X =
                                                                            p
                                                           number of subgroups
                                                  LCL = X  − A s
                                                              3
                                                  UCL = X  + A s
                                                              3
                                Using the data in Table 9.3:

                                                  sum of subgroup averages   2487 5 .
                                              X =                          =       = 99 5 .
                                                    number of subgroups        25
                                                                     u
                                                                      ×
                                                               − .
                                           LCL = X  − A s  = 99 5 1 427 6 2 . 118 =  90 63
                                                             .
                                                                                 .
                                               X       3
                                                               +
                                                                      ×
                                          UCL   = X + A s  = 99 5 1 427 6 218 = 108 37
                                                             .
                                                                         .
                                                                                  .
                                                                  .
                                               X       3
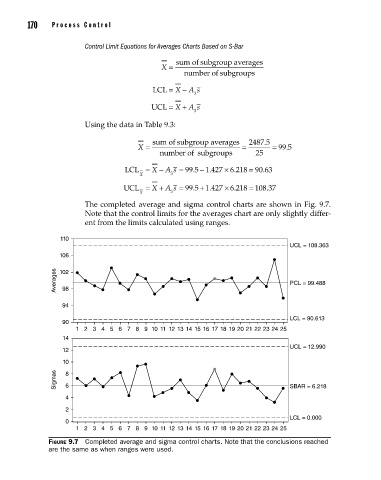
                                The completed average and sigma control charts are shown in Fig. 9.7.
                                Note that the control limits for the averages chart are only slightly differ-
                                ent from the limits calculated using ranges.
                         110
                                                                                        UCL = 108.363
                         106
                        Averages  102                                                   PCL = 99.488
                         98
                         94

                                                                                        LCL = 90.613
                         90
                             1 2 3 4 5 6 7 8 9 10 11 12 13 14 15 16 17 18 19 20 21 22 23 24 25
                         14
                                                                                        UCL = 12.990
                         12
                         10
                        Sigmas  8                                                       SBAR = 6.218
                          6
                          4
                          2
                                                                                        LCL = 0.000
                          0
                             1 2 3 4 5 6 7 8 9 10 11 12 13 14 15 16 17 18 19 20 21 22 23 24 25
                      Figure 9.7  Completed average and sigma control charts. Note that the conclusions reached
                      are the same as when ranges were used.


          09_Pyzdek_Ch09_p151-208.indd   170                                                           11/21/12   1:42 AM
   178   179   180   181   182   183   184   185   186   187   188