Page 187 - The Handbook for Quality Management a Complete Guide to Operational Excellence
P. 187

174    P r o c e s s   C o n t r o l                                                                                                                           Q u a n t i f y i n g   P r o c e s s   Va r i a t i o n    175
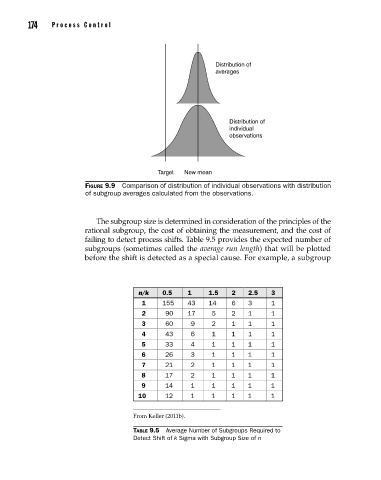


                                                                    Distribution of
                                                                    averages


                                                                       Distribution of
                                                                       individual
                                                                       observations


                                                    Target  New mean
                                Figure 9.9  Comparison of distribution of individual observations with distribution
                                of subgroup averages calculated from the observations.


                                   The subgroup size is determined in consideration of the principles of the
                                rational subgroup, the cost of obtaining the measurement, and the cost of
                                failing to detect process shifts. Table 9.5 provides the expected number of
                                subgroups (sometimes called the average run length) that will be plotted
                                before the shift is detected as a special cause. For example, a subgroup


                                              n/k    0.5    1     1.5   2    2.5   3
                                               1     155    43    14    6    3     1
                                               2      90    17     5    2    1     1
                                               3      60     9     2    1    1     1
                                               4      43     6     1    1    1     1
                                               5      33     4     1    1    1     1
                                               6      26     3     1    1    1     1
                                               7      21     2     1    1    1     1
                                               8      17     2     1    1    1     1
                                               9      14     1     1    1    1     1
                                              10      12     1     1    1    1     1

                                             From Keller (2011b).

                                             Table 9.5  Average Number of Subgroups Required to
                                             Detect Shift of k Sigma with Subgroup Size of n


          09_Pyzdek_Ch09_p151-208.indd   174                                                           11/21/12   1:42 AM
   182   183   184   185   186   187   188   189   190   191   192