
Page 191 - The Handbook for Quality Management a Complete Guide to Operational Excellence
P. 191
178 P r o c e s s C o n t r o l Q u a n t i f y i n g P r o c e s s Va r i a t i o n 179
In the above equations, n is the subgroup size. If the subgroup sizes
varies, the control limits will also vary, becoming closer together as n
increases.
As with all control charts, a special cause is probably present if there are
any points beyond either the upper or the lower control limit. Analysis of
p chart patterns between the control limits is extremely complicated if the
sample size varies because the distribution of p varies with the sample size.
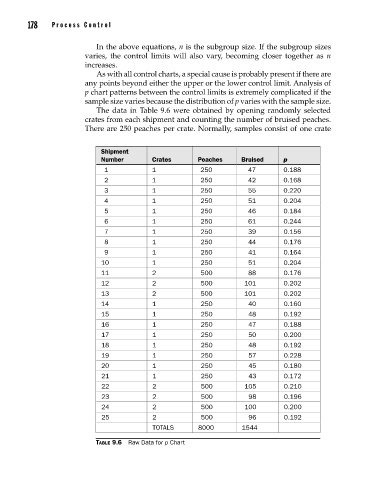
The data in Table 9.6 were obtained by opening randomly selected
crates from each shipment and counting the number of bruised peaches.
There are 250 peaches per crate. Normally, samples consist of one crate
Shipment
Number Crates Peaches Bruised p
1 1 250 47 0.188
2 1 250 42 0.168
3 1 250 55 0.220
4 1 250 51 0.204
5 1 250 46 0.184
6 1 250 61 0.244
7 1 250 39 0.156
8 1 250 44 0.176
9 1 250 41 0.164
10 1 250 51 0.204
11 2 500 88 0.176
12 2 500 101 0.202
13 2 500 101 0.202
14 1 250 40 0.160
15 1 250 48 0.192
16 1 250 47 0.188
17 1 250 50 0.200
18 1 250 48 0.192
19 1 250 57 0.228
20 1 250 45 0.180
21 1 250 43 0.172
22 2 500 105 0.210
23 2 500 98 0.196
24 2 500 100 0.200
25 2 500 96 0.192
TOTALS 8000 1544
Table 9.6 Raw Data for p Chart
09_Pyzdek_Ch09_p151-208.indd 178 11/21/12 1:42 AM