
Page 193 - The Handbook for Quality Management a Complete Guide to Operational Excellence
P. 193
180 P r o c e s s C o n t r o l Q u a n t i f y i n g P r o c e s s Va r i a t i o n 181
0.27
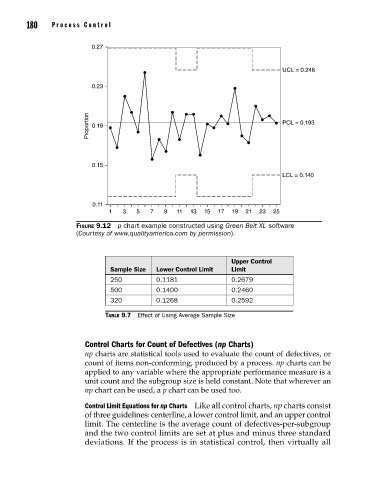
UCL = 0.246
0.23
Proportion 0.19 PCL = 0.193
0.15
LCL = 0.140
0.11
1 3 5 7 9 11 13 15 17 19 21 23 25
Figure 9.12 p chart example constructed using Green Belt XL software
(Courtesy of www.qualityamerica.com by permission).
Upper Control
Sample Size Lower Control Limit Limit
250 0.1181 0.2679
500 0.1400 0.2460
320 0.1268 0.2592
Table 9.7 Effect of Using Average Sample Size
Control Charts for Count of Defectives (np Charts)
np charts are statistical tools used to evaluate the count of defectives, or
count of items non-conforming, produced by a process. np charts can be
applied to any variable where the appropriate performance measure is a
unit count and the subgroup size is held constant. Note that wherever an
np chart can be used, a p chart can be used too.
Control Limit Equations for np Charts Like all control charts, np charts consist
of three guidelines: centerline, a lower control limit, and an upper control
limit. The centerline is the average count of defectives-per-subgroup
and the two control limits are set at plus and minus three standard
deviations. If the process is in statistical control, then virtually all
09_Pyzdek_Ch09_p151-208.indd 180 11/21/12 1:42 AM