Page 196 - The Handbook for Quality Management a Complete Guide to Operational Excellence
P. 196

182   P r o c e s s   C o n t r o l                              Q u a n t i f y i n g   P r o c e s s   Va r i a t i o n    183


                                     47.5


                                    42.5                                               UCL = 42.877


                                     37.5


                                    32.5
                                   Defective  27.5                                     PCL = 27.933


                                    22.5


                                     17.5


                                    12.5                                               LCL = 12.990
                                         1    4   7   10   13   16  19   22  25   28
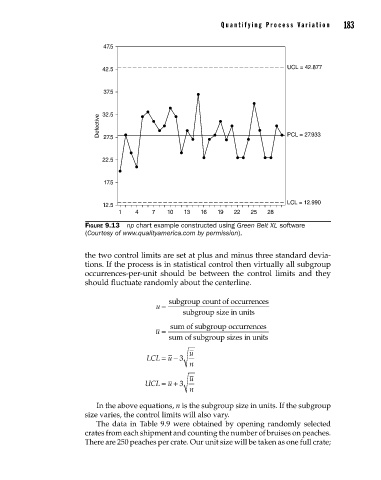
                                Figure 9.13  np chart example constructed using Green Belt XL software
                                (Courtesy of www.qualityamerica.com by permission).


                                the two control limits are set at plus and minus three standard devia-
                                tions. If the process is in statistical control then virtually all subgroup
                                occurrences-per-unit  should  be  between  the  control  limits  and  they
                                should fluctuate randomly about the centerline.


                                                       subgroup count of occurrences
                                                   u =
                                                                      e
                                                           subgroup size in units
                                                       sum of subgroup occurrences
                                                   u =
                                                       sum of subgroup sizes in units
                                                            u
                                                 LCL = u − 3
                                                            n

                                                            u
                                                UCL = u + 3
                                                          3
                                                            n
                                   In the above equations, n is the subgroup size in units. If the subgroup
                                size varies, the control limits will also vary.
                                   The data in Table 9.9 were obtained by opening randomly selected
                                crates from each shipment and counting the number of bruises on peaches.
                                There are 250 peaches per crate. Our unit size will be taken as one full crate;


          09_Pyzdek_Ch09_p151-208.indd   183                                                           11/21/12   1:42 AM
   191   192   193   194   195   196   197   198   199   200   201