Page 197 - The Handbook for Quality Management a Complete Guide to Operational Excellence
P. 197

184    P r o c e s s   C o n t r o l                                                                                                                           Q u a n t i f y i n g   P r o c e s s   Va r i a t i o n    185


                                            Shipment     Units              Flaws-per-
                                            Number       (Crates)  Flaws    Unit
                                             1            1           47    47
                                             2            1           42    42
                                             3            1           55    55
                                             4            1           51    51
                                             5            1           46    46
                                             6            1           61    61
                                             7            1           39    39
                                             8            1           44    44
                                             9            1           41    41
                                            10            1           51    51
                                            11            2           88    44
                                            12            2          101    50.5
                                            13            2          101    50.5
                                            14            1           40    40
                                            15            1           48    48
                                            16            1           47    47
                                            17            1           50    50
                                            18            1           48    48
                                            19            1           57    57
                                            20            1           45    45
                                            21            1           43    43
                                            22            2          105    52.5
                                            23            2           98    49
                                            24            2          100    50
                                            25            2           96    48
                                            TOTALS       32         1544

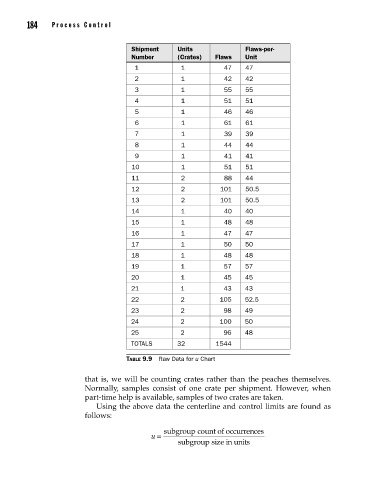
                                           Table 9.9  Raw Data for u Chart

                                that is, we will be counting crates rather than the peaches themselves.
                                Normally,  samples  consist  of  one  crate  per  shipment.  However,  when
                                part-time help is available, samples of two crates are taken.
                                   Using the above data the centerline and control limits are found as
                                follows:

                                                     subgroup count of occurrences
                                                  u =
                                                                     e
                                                         subgroup size in units


          09_Pyzdek_Ch09_p151-208.indd   184                                                           11/21/12   1:42 AM
   192   193   194   195   196   197   198   199   200   201   202