Page 202 - The Handbook for Quality Management a Complete Guide to Operational Excellence
P. 202

188   P r o c e s s   C o n t r o l                              Q u a n t i f y i n g   P r o c e s s   Va r i a t i o n    189


                                    52.5
                                                                                       UCL = 50.906


                                    45.0


                                     37.5
                                   Defects                                             PCL = 33.533


                                    30.0


                                    22.5


                                                                                       LCL = 16.161
                                    15.0
                                         1    4   7   10   13   16  19   22  25   28
                                Figure 9.15  c chart example constructed using Green Belt XL software
                                (courtesy of www.qualityamerica.com by permission).

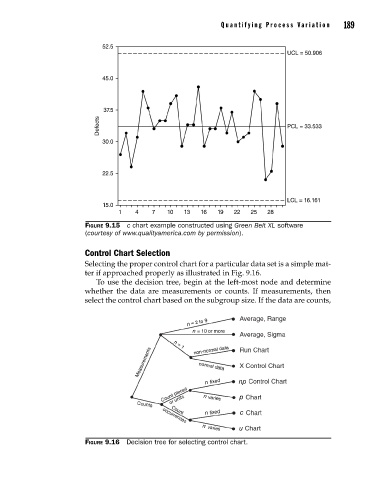
                                Control Chart Selection
                                Selecting the proper control chart for a particular data set is a simple mat-
                                ter if approached properly as illustrated in Fig. 9.16.
                                   To use the decision tree, begin at the left-most node and determine
                                whether  the  data  are  measurements  or  counts.  If  measurements,  then
                                select the control chart based on the subgroup size. If the data are counts,


                                                            n
                                                             n
                                                        n


                                                                 n        np
                                                                n         p

                                                                 n        c
                                                                n         u

                                Figure 9.16  Decision tree for selecting control chart.


          09_Pyzdek_Ch09_p151-208.indd   189                                                           11/21/12   1:42 AM
   197   198   199   200   201   202   203   204   205   206   207