
Page 207 - The Handbook for Quality Management a Complete Guide to Operational Excellence
P. 207
194 P r o c e s s C o n t r o l Q u a n t i f y i n g P r o c e s s Va r i a t i o n 195
T T T T T
M M M M M M M
T = Ted
M = Mary
0
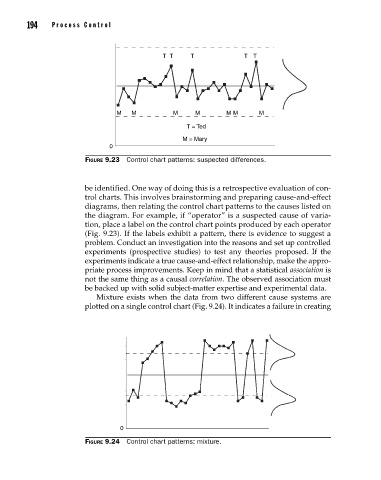
Figure 9.23 Control chart patterns: suspected differences.
be identified. One way of doing this is a retrospective evaluation of con-
trol charts. This involves brainstorming and preparing cause-and-effect
diagrams, then relating the control chart patterns to the causes listed on
the diagram. For example, if “operator” is a suspected cause of varia-
tion, place a label on the control chart points produced by each operator
(Fig. 9.23). If the labels exhibit a pattern, there is evidence to suggest a
problem. Conduct an investigation into the reasons and set up controlled
experiments (prospective studies) to test any theories proposed. If the
experiments indicate a true cause-and-effect relationship, make the appro-
priate process improvements. Keep in mind that a statistical association is
not the same thing as a causal correlation. The observed association must
be backed up with solid subject-matter expertise and experimental data.
Mixture exists when the data from two different cause systems are
plotted on a single control chart (Fig. 9.24). It indicates a failure in creating
0
Figure 9.24 Control chart patterns: mixture.
09_Pyzdek_Ch09_p151-208.indd 194 11/21/12 1:42 AM