
Page 211 - The Handbook for Quality Management a Complete Guide to Operational Excellence
P. 211
198 P r o c e s s C o n t r o l Q u a n t i f y i n g P r o c e s s Va r i a t i o n 199
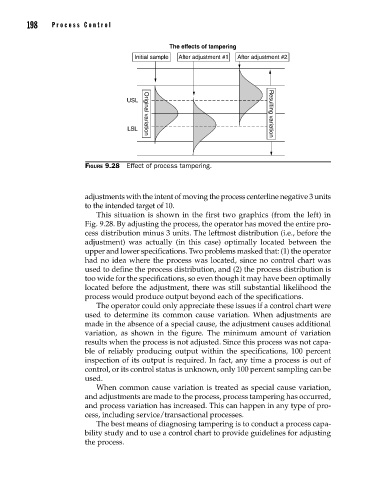
The effects of tampering
Initial sample After adjustment #1 After adjustment #2
USL Original variation
LSL Resulting variation
Figure 9.28 Effect of process tampering.
adjustments with the intent of moving the process centerline negative 3 units
to the intended target of 10.
This situation is shown in the first two graphics (from the left) in
Fig. 9.28. By adjusting the process, the operator has moved the entire pro-
cess distribution minus 3 units. The leftmost distribution (i.e., before the
adjustment) was actually (in this case) optimally located between the
upper and lower specifications. Two problems masked that: (1) the operator
had no idea where the process was located, since no control chart was
used to define the process distribution, and (2) the process distribution is
too wide for the specifications, so even though it may have been optimally
located before the adjustment, there was still substantial likelihood the
process would produce output beyond each of the specifications.
The operator could only appreciate these issues if a control chart were
used to determine its common cause variation. When adjustments are
made in the absence of a special cause, the adjustment causes additional
variation, as shown in the figure. The minimum amount of variation
results when the process is not adjusted. Since this process was not capa-
ble of reliably producing output within the specifications, 100 percent
inspection of its output is required. In fact, any time a process is out of
control, or its control status is unknown, only 100 percent sampling can be
used.
When common cause variation is treated as special cause variation,
and adjustments are made to the process, process tampering has occurred,
and process variation has increased. This can happen in any type of pro-
cess, including service/transactional processes.
The best means of diagnosing tampering is to conduct a process capa-
bility study and to use a control chart to provide guidelines for adjusting
the process.
09_Pyzdek_Ch09_p151-208.indd 198 11/21/12 1:42 AM