
Page 212 - The Handbook for Quality Management a Complete Guide to Operational Excellence
P. 212
198 P r o c e s s C o n t r o l Q u a n t i f y i n g P r o c e s s Va r i a t i o n 199
Perhaps the best analysis of the effects of tampering is from Deming
(1986). Deming describes four common types of tampering by drawing
the analogy of aiming a funnel to hit a desired target. These “funnel rules”
are described by Deming (1986, p. 328):
1. “Leave the funnel fixed, aimed at the target, no adjustment.”
2. “At drop k (k = 1, 2, 3, ...) the marble will come to rest at point z ,
k
measured from the target. (In other words, z is the error at drop k.)
k
Move the funnel the distance –z from the last position. Memory 1.”
k
3. “Set the funnel at each drop right over the spot z , measured from
k
the target. No memory.”
4. “Set the funnel at each drop right over the spot (z ) where it last
k
came to rest. No memory.”
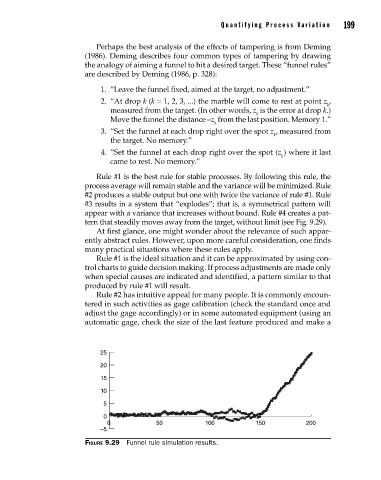
Rule #1 is the best rule for stable processes. By following this rule, the
process average will remain stable and the variance will be minimized. Rule
#2 produces a stable output but one with twice the variance of rule #1. Rule
#3 results in a system that “explodes”; that is, a symmetrical pattern will
appear with a variance that increases without bound. Rule #4 creates a pat-
tern that steadily moves away from the target, without limit (see Fig. 9.29).
At first glance, one might wonder about the relevance of such appar-
ently abstract rules. However, upon more careful consideration, one finds
many practical situations where these rules apply.
Rule #1 is the ideal situation and it can be approximated by using con-
trol charts to guide decision making. If process adjustments are made only
when special causes are indicated and identified, a pattern similar to that
produced by rule #1 will result.
Rule #2 has intuitive appeal for many people. It is commonly encoun-
tered in such activities as gage calibration (check the standard once and
adjust the gage accordingly) or in some automated equipment (using an
automatic gage, check the size of the last feature produced and make a
25
20
15
10
5
0
0 50 100 150 200
–5
Figure 9.29 Funnel rule simulation results.
09_Pyzdek_Ch09_p151-208.indd 199 11/21/12 1:42 AM