
Page 209 - The Handbook for Quality Management a Complete Guide to Operational Excellence
P. 209
196 P r o c e s s C o n t r o l Q u a n t i f y i n g P r o c e s s Va r i a t i o n 197
UCL +3σ
A
+2σ
B
+1σ
C
= µ
X
C
–1σ
B
–2σ
A
LCL –3σ
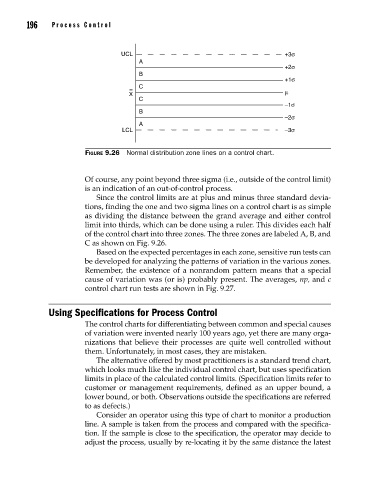
Figure 9.26 Normal distribution zone lines on a control chart.
Of course, any point beyond three sigma (i.e., outside of the control limit)
is an indication of an out-of-control process.
Since the control limits are at plus and minus three standard devia-
tions, finding the one and two sigma lines on a control chart is as simple
as dividing the distance between the grand average and either control
limit into thirds, which can be done using a ruler. This divides each half
of the control chart into three zones. The three zones are labeled A, B, and
C as shown on Fig. 9.26.
Based on the expected percentages in each zone, sensitive run tests can
be developed for analyzing the patterns of variation in the various zones.
Remember, the existence of a nonrandom pattern means that a special
cause of variation was (or is) probably present. The averages, np, and c
control chart run tests are shown in Fig. 9.27.
Using Specifications for Process Control
The control charts for differentiating between common and special causes
of variation were invented nearly 100 years ago, yet there are many orga-
nizations that believe their processes are quite well controlled without
them. Unfortunately, in most cases, they are mistaken.
The alternative offered by most practitioners is a standard trend chart,
which looks much like the individual control chart, but uses specification
limits in place of the calculated control limits. (Specification limits refer to
customer or management requirements, defined as an upper bound, a
lower bound, or both. Observations outside the specifications are referred
to as defects.)
Consider an operator using this type of chart to monitor a production
line. A sample is taken from the process and compared with the specifica-
tion. If the sample is close to the specification, the operator may decide to
adjust the process, usually by re-locating it by the same distance the latest
09_Pyzdek_Ch09_p151-208.indd 196 11/21/12 1:42 AM