
Page 208 - The Handbook for Quality Management a Complete Guide to Operational Excellence
P. 208
194 P r o c e s s C o n t r o l Q u a n t i f y i n g P r o c e s s Va r i a t i o n 195
rational subgroups. The underlying differences should be identified and
corrective action taken. The nature of the corrective action will determine
how the control chart should be modified.
For example, if the mixture represents two different operators who can
be made more consistent, then a single control chart can be used to monitor
the new, consistent process. Alternatively, if the mixture represents the dif-
ference in the number of emergency room cases received on Saturday eve-
ning, versus the number received during the week, then separate control
charts should be used to monitor patient-load during the two different time
periods.
Run Tests
If the process is stable, then the distribution of subgroup averages will
be approximately normal. With this in mind, we can also analyze the
patterns on the control charts to see if they might be attributed to a spe-
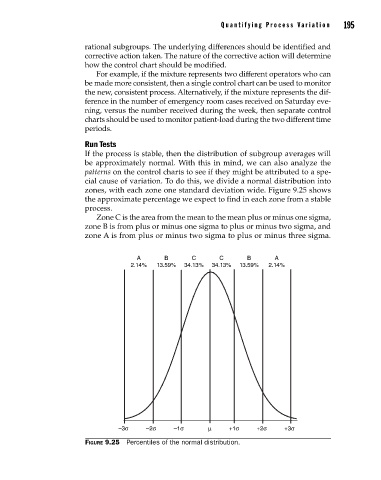
cial cause of variation. To do this, we divide a normal distribution into
zones, with each zone one standard deviation wide. Figure 9.25 shows
the approximate percentage we expect to find in each zone from a stable
process.
Zone C is the area from the mean to the mean plus or minus one sigma,
zone B is from plus or minus one sigma to plus or minus two sigma, and
zone A is from plus or minus two sigma to plus or minus three sigma.
A B C C B A
2.14% 13.59% 34.13% 34.13% 13.59% 2.14%
–3σ –2σ –1σ µ +1σ +2σ +3σ
Figure 9.25 Percentiles of the normal distribution.
09_Pyzdek_Ch09_p151-208.indd 195 11/21/12 1:42 AM