
Page 203 - The Handbook for Quality Management a Complete Guide to Operational Excellence
P. 203
190 P r o c e s s C o n t r o l Q u a n t i f y i n g P r o c e s s Va r i a t i o n 191
then determine whether the counts are of occurrences or pieces. An aid in
making this determination is to examine the equation for the process
average. If the numerator and denominator involve the same units, then
a p or np chart is indicated. If different units of measure are involved,
then a u or c chart is indicated. For example, if the average is in accidents-
per-month, then a c or u chart is indicated because the numerator is in
terms of accidents but the denominator is in terms of time.
Control Chart Interpretation
Control charts provide the operational definition of the term special cause.
A special cause is simply anything that leads to an observation beyond a
control limit. However, this simplistic use of control charts does not do
justice to their power. Control charts are running records of the perfor-
mance of the process and, as such, they contain a vast store of information
on potential improvements. While some guidelines are presented here,
control chart interpretation is an art that can only be developed by looking
at many control charts and probing the patterns to identify the underlying
system of causes at work.
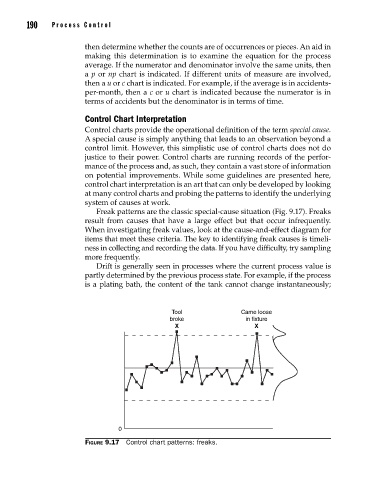
Freak patterns are the classic special-cause situation (Fig. 9.17). Freaks
result from causes that have a large effect but that occur infrequently.
When investigating freak values, look at the cause-and-effect diagram for
items that meet these criteria. The key to identifying freak causes is timeli-
ness in collecting and recording the data. If you have difficulty, try sampling
more frequently.
Drift is generally seen in processes where the current process value is
partly determined by the previous process state. For example, if the process
is a plating bath, the content of the tank cannot change instantaneously;
Tool Came loose
broke in fixture
X X
0
Figure 9.17 Control chart patterns: freaks.
09_Pyzdek_Ch09_p151-208.indd 190 11/21/12 1:42 AM