
Page 206 - The Handbook for Quality Management a Complete Guide to Operational Excellence
P. 206
192 P r o c e s s C o n t r o l Q u a n t i f y i n g P r o c e s s Va r i a t i o n 193
0
Figure 9.21 Control chart patterns: discrete data.
The usual cause of this situation is inadequate gage resolution. The
ideal solution is to obtain a gage with greater resolution. Sometimes the
problem occurs because operators, inspectors, or computers are rounding
the numbers. The solution here is to record additional digits.
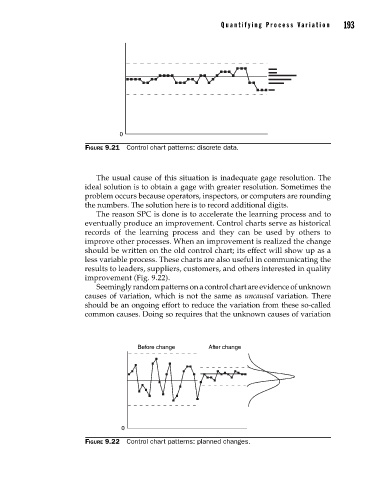
The reason SPC is done is to accelerate the learning process and to
eventually produce an improvement. Control charts serve as historical
records of the learning process and they can be used by others to
improve other processes. When an improvement is realized the change
should be written on the old control chart; its effect will show up as a
less variable process. These charts are also useful in communicating the
results to leaders, suppliers, customers, and others interested in quality
improvement (Fig. 9.22).
Seemingly random patterns on a control chart are evidence of unknown
causes of variation, which is not the same as uncaused variation. There
should be an ongoing effort to reduce the variation from these so-called
common causes. Doing so requires that the unknown causes of variation
Before change After change
0
Figure 9.22 Control chart patterns: planned changes.
09_Pyzdek_Ch09_p151-208.indd 193 11/21/12 1:42 AM