
Page 201 - The Handbook for Quality Management a Complete Guide to Operational Excellence
P. 201
188 P r o c e s s C o n t r o l Q u a n t i f y i n g P r o c e s s Va r i a t i o n 189
Shipment Number Flaws
1 27
2 32
3 24
4 31
5 42
6 38
7 33
8 35
9 35
10 39
11 41
12 29
13 34
14 34
15 43
16 29
17 33
18 33
19 38
20 32
21 37
22 30
23 31
24 32
25 42
26 40
27 21
28 23
29 39
30 29
TOTAL 1006
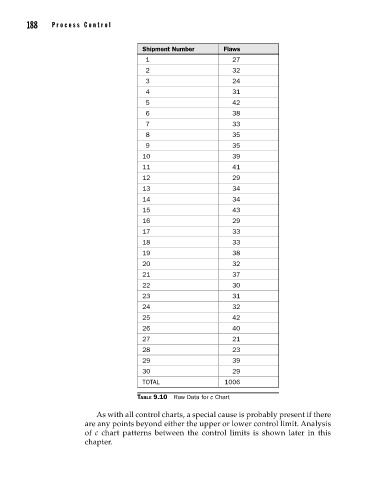
Table 9.10 Raw Data for c Chart
As with all control charts, a special cause is probably present if there
are any points beyond either the upper or lower control limit. Analysis
of c chart patterns between the control limits is shown later in this
chapter.
09_Pyzdek_Ch09_p151-208.indd 188 11/21/12 1:42 AM