
Page 204 - The Handbook for Quality Management a Complete Guide to Operational Excellence
P. 204
190 P r o c e s s C o n t r o l Q u a n t i f y i n g P r o c e s s Va r i a t i o n 191
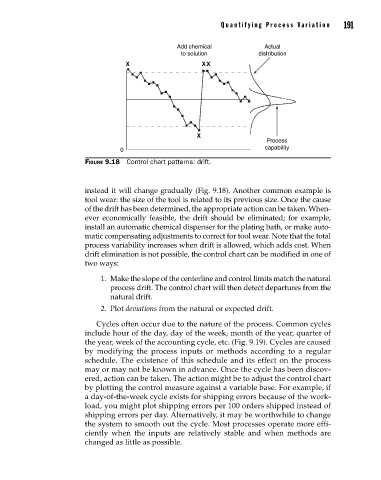
Add chemical Actual
to solution distribution
X XX
X
Process
0 capability
Figure 9.18 Control chart patterns: drift.
instead it will change gradually (Fig. 9.18). Another common example is
tool wear: the size of the tool is related to its previous size. Once the cause
of the drift has been determined, the appropriate action can be taken. When-
ever economically feasible, the drift should be eliminated; for example,
install an automatic chemical dispenser for the plating bath, or make auto-
matic compensating adjustments to correct for tool wear. Note that the total
process variability increases when drift is allowed, which adds cost. When
drift elimination is not possible, the control chart can be modified in one of
two ways:
1. Make the slope of the centerline and control limits match the natural
process drift. The control chart will then detect departures from the
natural drift.
2. Plot deviations from the natural or expected drift.
Cycles often occur due to the nature of the process. Common cycles
include hour of the day, day of the week, month of the year, quarter of
the year, week of the accounting cycle, etc. (Fig. 9.19). Cycles are caused
by modifying the process inputs or methods according to a regular
schedule. The existence of this schedule and its effect on the process
may or may not be known in advance. Once the cycle has been discov-
ered, action can be taken. The action might be to adjust the control chart
by plotting the control measure against a variable base. For example, if
a day-of-the-week cycle exists for shipping errors because of the work-
load, you might plot shipping errors per 100 orders shipped instead of
shipping errors per day. Alternatively, it may be worthwhile to change
the system to smooth out the cycle. Most processes operate more effi-
ciently when the inputs are relatively stable and when methods are
changed as little as possible.
09_Pyzdek_Ch09_p151-208.indd 191 11/21/12 1:42 AM