Page 198 - The Handbook for Quality Management a Complete Guide to Operational Excellence
P. 198

184   P r o c e s s   C o n t r o l                              Q u a n t i f y i n g   P r o c e s s   Va r i a t i o n    185


                                   These values are shown in the last column of Table 9.9.
                                           sum of subgroup count of occurrences  1544
                                        u =                                   =      = 48.25
                                                sum of subgroup unit sizes       32
                                                      f
                                   which is constant for all subgroups.
                                n = 1 unit:

                                                                          .
                                                          u             48 25
                                               LCL =  u − 3  = 48 25 3       = 27 411
                                                                   −
                                                                                 .
                                                                .
                                                          n              1
                                                                          .
                                                          u             48 25
                                              UCL =  u + 3  = 48.225 3+      =  69 089
                                                                                 .
                                                          n               1
                                n = 2 units:
                                                                   48 25
                                                                     .
                                                              −
                                                           .
                                                   LCL = 48 25 3        = 33 514
                                                                            .
                                                                     2
                                                                     .
                                                                   48 25
                                                              +
                                                                            .
                                                                           2
                                                   UCL = 48 25 3        = 62 986
                                                           .
                                                                     2
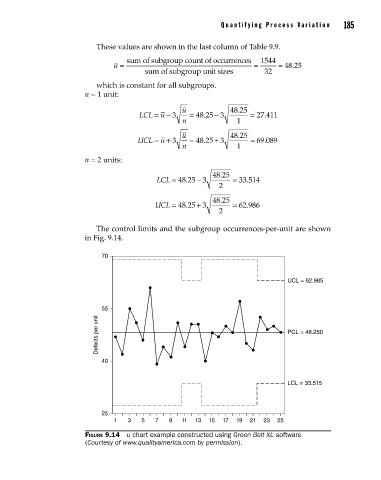
                                   The control limits and the subgroup occurrences-per-unit are shown
                                in Fig. 9.14.
                                    70
                                                                                       UCL = 62.985

                                    55
                                   Defects per unit                                    PCL = 48.250


                                    40


                                                                                       LCL = 33.515


                                    25
                                        1  3   5   7   9  11  13  15  17  19  21  23  25
                                Figure 9.14  u chart example constructed using Green Belt XL software
                                (Courtesy of www.qualityamerica.com by permission).


          09_Pyzdek_Ch09_p151-208.indd   185                                                           11/21/12   1:42 AM
   193   194   195   196   197   198   199   200   201   202   203