Page 195 - The Handbook for Quality Management a Complete Guide to Operational Excellence
P. 195

182    P r o c e s s   C o n t r o l                                                                                                                           Q u a n t i f y i n g   P r o c e s s   Va r i a t i o n    183


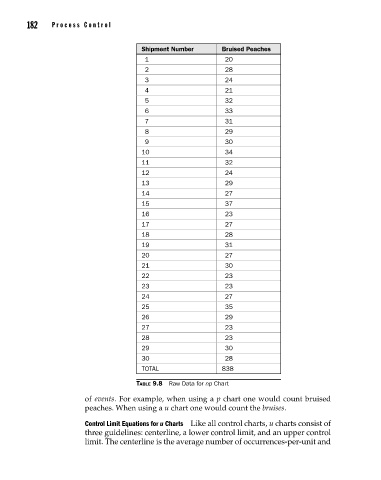
                                               Shipment Number       Bruised Peaches
                                                1                     20
                                                2                     28
                                                3                     24
                                                4                     21
                                                5                     32
                                                6                     33
                                                7                     31
                                                8                     29
                                                9                     30
                                               10                     34
                                               11                     32
                                               12                     24
                                               13                     29
                                               14                     27
                                               15                     37
                                               16                     23
                                               17                     27
                                               18                     28
                                               19                     31
                                               20                     27
                                               21                     30
                                               22                     23
                                               23                     23
                                               24                     27
                                               25                     35
                                               26                     29
                                               27                     23
                                               28                     23
                                               29                     30
                                               30                     28
                                               TOTAL                 838

                                              Table 9.8  Raw Data for np Chart
                                of events. For example, when using a p chart one would count bruised
                                peaches. When using a u chart one would count the bruises.
                                Control Limit Equations for u Charts  Like all control charts, u charts consist of
                                three guidelines: centerline, a lower control limit, and an upper control
                                limit. The centerline is the average number of occurrences-per-unit and


          09_Pyzdek_Ch09_p151-208.indd   182                                                           11/21/12   1:42 AM
   190   191   192   193   194   195   196   197   198   199   200