Page 190 - The Handbook for Quality Management a Complete Guide to Operational Excellence
P. 190

176   P r o c e s s   C o n t r o l                              Q u a n t i f y i n g   P r o c e s s   Va r i a t i o n    177


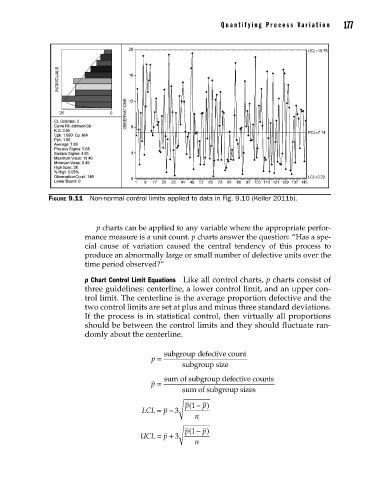
                      Figure 9.11  Non-normal control limits applied to data in Fig. 9.10 (Keller 2011b).


                                   p charts can be applied to any variable where the appropriate perfor-
                                mance measure is a unit count. p charts answer the question: “Has a spe-
                                cial  cause  of  variation  caused  the  central  tendency  of  this  process  to
                                produce an abnormally large or small number of defective units over the
                                time period observed?”

                                p Chart Control Limit Equations  Like all control charts, p charts consist of
                                three guidelines: centerline, a lower control limit, and an upper con-
                                trol limit. The centerline is the average proportion defective and the
                                two control limits are set at plus and minus three standard deviations.
                                If the process is in statistical control, then virtually all proportions
                                should be between the control limits and they should fluctuate ran-
                                domly about the centerline.

                                                     subgroup defective count
                                                  p =
                                                          subgroup size

                                                       m
                                                     sum of subgroup defective counts
                                                  p =
                                                                      o
                                                          sum of subgroup sizes
                                                           p −  p)
                                                             1 (
                                               LCL =  p − 3
                                                              n
                                                           p −  p)
                                                             1 (
                                               UCL =  p + 3
                                                              n


          09_Pyzdek_Ch09_p151-208.indd   177                                                           11/21/12   1:42 AM
   185   186   187   188   189   190   191   192   193   194   195