Page 185 - The Handbook for Quality Management a Complete Guide to Operational Excellence
P. 185

172    P r o c e s s   C o n t r o l                                                                                                                           Q u a n t i f y i n g   P r o c e s s   Va r i a t i o n    173


                                                 Sample 1        Range
                                                 110             None
                                                 103              7
                                                  97              6
                                                  96              1
                                                 105              9
                                                 110              5
                                                 100             10
                                                  93              7
                                                  90              3
                                                 103             13
                                                  97              6
                                                 103              6
                                                  90             13
                                                  97              7
                                                  99              2
                                                 106              7
                                                  90             16
                                                  96              6
                                                 109             13
                                                  90             19
                                                  91              1
                                                 108             17
                                                  96             12
                                                 101              5
                                                  96              5

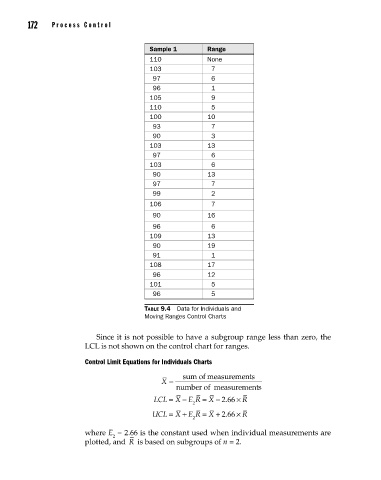
                                                Table 9.4  Data for Individuals and
                                                Moving Ranges Control Charts


                                   Since it is not possible to have a subgroup range less than zero, the
                                LCL is not shown on the control chart for ranges.

                                Control Limit Equations for Individuals Charts
                                                           sum of measurements
                                                     X =
                                                         number of measurements s
                                                   LCL = X E R =  X − 2 66.  × R
                                                           −
                                                             2
                                                           +
                                                  UCL = X E R =   X + 2 66.  × R
                                                             2
                                where E  = 2.66 is the constant used when individual measurements are
                                       2
                                plotted, and  R  is based on subgroups of n = 2.


          09_Pyzdek_Ch09_p151-208.indd   172                                                           11/21/12   1:42 AM
   180   181   182   183   184   185   186   187   188   189   190