
Page 181 - The Handbook for Quality Management a Complete Guide to Operational Excellence
P. 181
168 P r o c e s s C o n t r o l Q u a n t i f y i n g P r o c e s s Va r i a t i o n 169
110
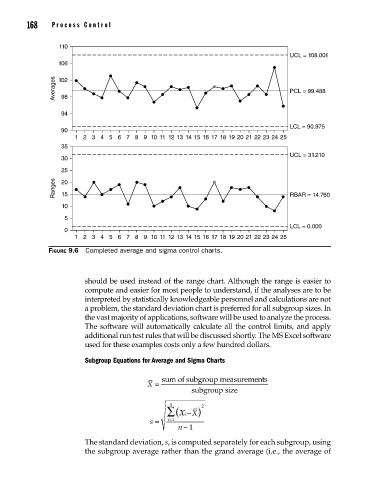
UCL = 108.001
106
Averages 102 PCL = 99.488
98
94
LCL = 90.975
90
1 2 3 4 5 6 7 8 9 10 11 12 13 14 15 16 17 18 19 20 21 22 23 24 25
35
UCL = 31.210
30
25
Ranges 20 RBAR = 14.760
15
10
5
LCL = 0.000
0
1 2 3 4 5 6 7 8 9 10 11 12 13 14 15 16 17 18 19 20 21 22 23 24 25
Figure 9.6 Completed average and sigma control charts.
should be used instead of the range chart. Although the range is easier to
compute and eas ier for most people to understand, if the analy ses are to be
interpreted by statistically knowledgeable personnel and calculations are not
a problem, the standard deviation chart is preferred for all subgroup sizes. In
the vast majority of applications, software will be used to analyze the process.
The software will automatically calculate all the control limits, and apply
additional run test rules that will be discussed shortly. The MS Excel software
used for these examples costs only a few hundred dollars.
Subgroup Equations for Average and Sigma Charts
sum of subgroup measurements
X =
subgroup size
n 2
∑( xi− X)
s s = i=1
n − 1
The standard deviation, s, is computed separately for each subgroup, using
the subgroup average rather than the grand average (i.e., the average of
09_Pyzdek_Ch09_p151-208.indd 168 11/21/12 1:42 AM