
Page 210 - The Handbook for Quality Management a Complete Guide to Operational Excellence
P. 210
196 P r o c e s s C o n t r o l Q u a n t i f y i n g P r o c e s s Va r i a t i o n 197
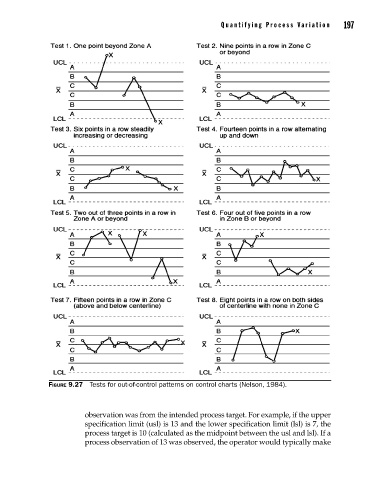
Figure 9.27 Tests for out-of-control patterns on control charts (Nelson, 1984).
observation was from the intended process target. For example, if the upper
specification limit (usl) is 13 and the lower specification limit (lsl) is 7, the
process target is 10 (calculated as the midpoint between the usl and lsl). If a
process observation of 13 was observed, the operator would typically make
09_Pyzdek_Ch09_p151-208.indd 197 11/21/12 1:42 AM