Page 217 - The Handbook for Quality Management a Complete Guide to Operational Excellence
P. 217

204    P r o c e s s   C o n t r o l                                                                                                                           Q u a n t i f y i n g   P r o c e s s   Va r i a t i o n    205


                                been achieved, the capability is the level created by the common causes of
                                process variation. The formulas for estimating the process standard devi-
                                ation are:
                                                                 R
                                Range chart method:        σ =
                                                             X
                                                                d
                                                                 2
                                                                 S
                                Sigma chart method:         σ =  c
                                                             X
                                                                 4
                                   The values d and c are constants from the table in Appendix 1.
                                              2     4

                                Process Capability Indexes
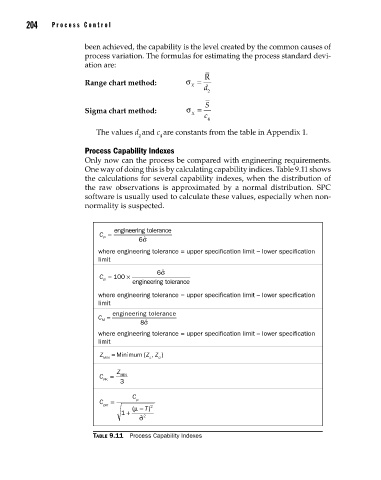
                                Only now can the process be compared with engineering requirements.
                                One way of doing this is by calculating capability indices. Table 9.11 shows
                                the calculations for several capability indexes, when the distribution of
                                the  raw  observations  is  approximated  by  a  normal  distribution.  SPC
                                software is usually used to calculate these values, especially when non-
                                normality is suspected.


                                        engineering tolerance
                                    C =       6ˆ σ
                                     P
                                   where engineering tolerance = upper specification limit – lower specification
                                   limit

                                                   6ˆ σ
                                    C = 100 ×  engineering tolerance
                                     R
                                   where engineering tolerance = upper specification limit – lower specification
                                   limit
                                       engineering tolerance
                                   C =
                                    M
                                               8ˆ σ
                                   where engineering tolerance = upper specification limit – lower specification
                                   limit
                                    Z  =  Minimum { Z Z }
                                                  ,
                                     MIN         L  U
                                        Z
                                    C  =  MIN
                                     PK  3
                                             C
                                    C  pm  =  p   2
                                          1  +  (µ  − T)
                                               ˆ σ 2

                                  Table 9.11  Process Capability Indexes


          09_Pyzdek_Ch09_p151-208.indd   204                                                           11/21/12   1:42 AM
   212   213   214   215   216   217   218   219   220   221   222