
Page 296 - The Handbook for Quality Management a Complete Guide to Operational Excellence
P. 296
282 C o n t i n u o u s I m p r o v e m e n t D e f i n e S t a g e 283
Normal Schedule Crash Schedule
Activity Time (days) Cost Time (days) Cost Slope
Excavate 2 1000 1 2000 1000
Foundation 4 1600 3 2400 800*
Rough wall 10 7500 6 14000 1625
Rough electrical work 7 7000 4 14000 2333
Rough exterior plumbing 4 4400 3 6000 1600
Rough interior plumbing 5 3750 3 7500 1875
Wall board 5 3500 3 7000 1750
Flooring 4 3200 2 5600 1200
Interior painting 5 3000 3 5500 1250
Interior fixtures 6 4800 2 11000 1550
Roof 6 4900 2 12000 1775
Exterior siding 7 5600 3 12000 1600
Exterior painting 9 4500 5 9000 1125
Exterior fixtures 2 1800 1 3200 1400
Table 13.7 Schedule Costs for Activities Involved in Constructing a House
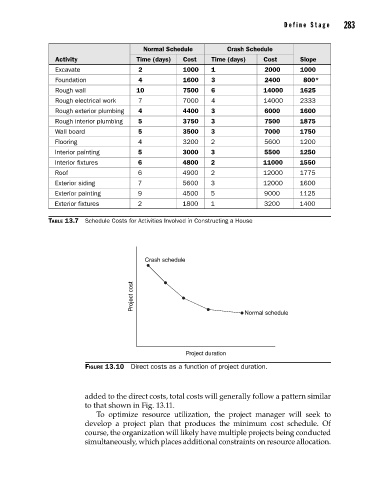
Crash schedule
Project cost
Normal schedule
Project duration
Figure 13.10 Direct costs as a function of project duration.
added to the direct costs, total costs will generally follow a pattern similar
to that shown in Fig. 13.11.
To optimize resource utilization, the project manager will seek to
develop a project plan that produces the minimum cost schedule. Of
course, the organ ization will likely have multiple projects being conducted
simultaneously, which places additional constraints on resource allocation.
13_Pyzdek_Ch13_p265-292.indd 283 11/9/12 5:14 PM