
Page 295 - The Handbook for Quality Management a Complete Guide to Operational Excellence
P. 295
282 C o n t i n u o u s I m p r o v e m e n t D e f i n e S t a g e 283
Crash Crash point
cost
Activity cost Normal point
Normal
cost
Crash Normal
duration duration
Activity duration
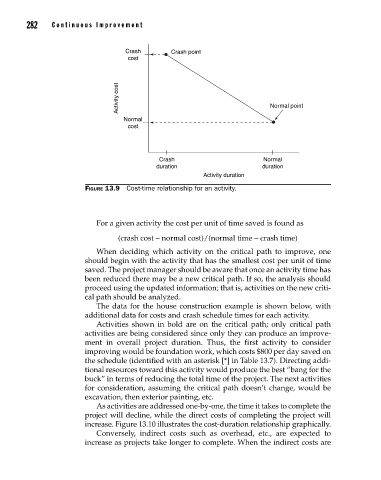
Figure 13.9 Cost-time relationship for an activity.
For a given activity the cost per unit of time saved is found as
(crash cost - normal cost)/(normal time - crash time)
When deciding which activity on the critical path to improve, one
should begin with the activity that has the smallest cost per unit of time
saved. The project manager should be aware that once an activity time has
been reduced there may be a new critical path. If so, the analysis should
proceed using the updated information; that is, activities on the new criti
cal path should be ana lyzed.
The data for the house construction example is shown below, with
addi tional data for costs and crash schedule times for each activity.
Activities shown in bold are on the critical path; only critical path
activities are being considered since only they can produce an improve
ment in overall project duration. Thus, the first activity to consider
improving would be foundation work, which costs $800 per day saved on
the schedule (identified with an asterisk [*] in Table 13.7). Directing addi
tional resources toward this activity would produce the best “bang for the
buck” in terms of reducing the total time of the project. The next activities
for consideration, assuming the critical path doesn’t change, would be
excavation, then exterior painting, etc.
As activities are addressed onebyone, the time it takes to complete the
project will decline, while the direct costs of completing the project will
increase. Figure 13.10 illustrates the costduration relationship graphically.
Conversely, indirect costs such as overhead, etc., are expected to
increase as projects take longer to complete. When the indirect costs are
13_Pyzdek_Ch13_p265-292.indd 282 11/9/12 5:14 PM