Page 329 - The Handbook for Quality Management a Complete Guide to Operational Excellence
P. 329

316    C o n t i n u o u s   I m p r o v e m e n t                                                                                                                              A n a l y z e   S t a g e    317


                                    •  Descriptive phase. The team defines the product or service from
                                      several different directions such as customer demands, functions,
                                      parts, reliability, cost, and so on.
                                    •  Breakthrough  phase.  The  team  selects  areas  for  improvement  and
                                      finds ways to make them better through new technology, new con-
                                      cepts, better reliability, cost reduction, etc., and monitors the bot-
                                      tleneck process.
                                    •  Implementation phase. The team defines the new product and how it
                                      will be manufactured.

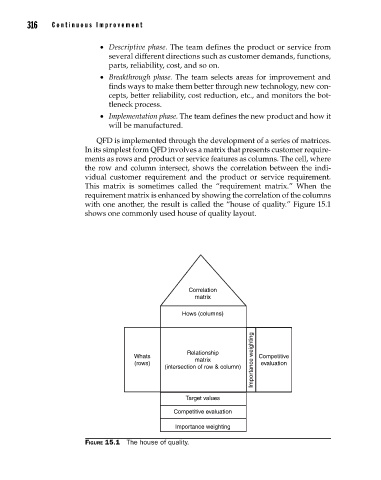
                                   QFD is implemented through the development of a series of matrices.
                                In its simplest form QFD involves a matrix that presents customer require-
                                ments as rows and product or service features as columns. The cell, where
                                the row and column intersect, shows the correlation between the indi-
                                vidual  customer  requirement  and  the  product  or  service  requirement.
                                This  matrix  is  sometimes  called  the  “requirement  matrix.”  When  the
                                requirement matrix is enhanced by showing the correlation of the columns
                                with one another, the result is called the “house of quality.” Figure 15.1
                                shows one commonly used house of quality layout.


                                                            Correlation
                                                              matrix

                                                          Hows (columns)


                                                                              Importance weighting
                                                            Relationship
                                             Whats                             Competitive
                                                              matrix
                                             (rows)                             evaluation
                                                      (intersection of row & column)


                                                           Target values

                                                        Competitive evaluation
                                                        Importance weighting

                                Figure 15.1  The house of quality.


          15_Pyzdek_Ch15_p305-334.indd   316                                                          11/20/12   10:33 PM
   324   325   326   327   328   329   330   331   332   333   334