
Page 414 - The Handbook for Quality Management a Complete Guide to Operational Excellence
P. 414
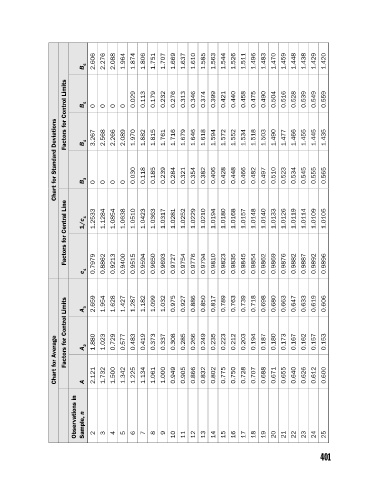
2.606  2.276  2.088  1.964  1.874  1.806  1.751  1.707  1.669  1.637  1.610  1.585  1.563  1.544  1.526  1.511  1.496  1.483  1.470  1.459  1.448  1.438  1.429  1.420
                               B 6

                          Factors for Control Limits  B 5  0  0  0  0  0.029  0.113  0.179  0.232  0.276  0.313  0.346  0.374  0.399  0.421  0.440  0.458  0.475  0.490  0.504  0.516  0.528  0.539  0.549  0.559


                        Chart for Standard Deviations  B 4  B 3  3.267  0  2.568  0  2.266  0  2.089  0  1.970  0.030  1.882  0.118  1.815  0.185  1.761  0.239  1.716  0.284  1.679  0.321  1.646  0.354  1.618  0.382  1.594  0.406  1.572  0.428  1.552  0.448  1.534  0.466  1.518  0.482  1.503  0.497  1.490  0.510  1.477  0.523  1.466  0.534  1.455  0.545  1.445  0.555  1.435  0.565


                          Factors for Central Line  1/c 4  1.2533  1.1284  1.0854  1.0638  1.0510  1.0423  1.0363  1.0317  1.0281  1.0252  1.0229  1.0210  1.0194  1.0180  1.0168  1.0157  1.0148  1.0140  1.0133  1.0126  1.0119  1.0114  1.0109  1.0105


                               c 4  0.7979  0.8862  0.9213  0.9400  0.9515  0.9594  0.9650  0.9693  0.9727  0.9754  0.9776  0.9794  0.9810  0.9823  0.9835  0.9845  0.9854  0.9862  0.9869  0.9876  0.9882  0.9887  0.9892  0.9896


                          Factors for Control Limits  A 3  2.659  1.880  1.954  1.023  1.628  0.729  1.427  0.577  1.287  0.483  1.182  0.419  1.099  0.373  1.032  0.337  0.975  0.308  0.927  0.285  0.886  0.266  0.850  0.249  0.817  0.235  0.789  0.223  0.763  0.212  0.739  0.203  0.718  0.194  0.698  0.187  0.680  0.180  0.663  0.173  0.647  0.167  0.633  0.162  0.619  0.157  0.606  0.153


                        Chart for Average  A 2  A  2.121  1.732  1.500  1.342  1.225  1.134  1.061  1.000  0.949  0.905  0.866  0.832  0.802  0.775  0.750  0.728  0.707  0.688  0.671  0.655  0.640  0.626  0.612  0.600


                             Observations in   Sample, n  2  3  4  5  6  7  8  9  10  11  12  13  14  15  16  17  18  19  20  21  22  23  24  25


                                                                                                 401


          21_Pyzdek_AppA_Ch21_p399-402.indd   401                                                       11/9/12   5:32 PM