
Page 419 - The Handbook for Quality Management a Complete Guide to Operational Excellence
P. 419
406 A p p e n d i x B
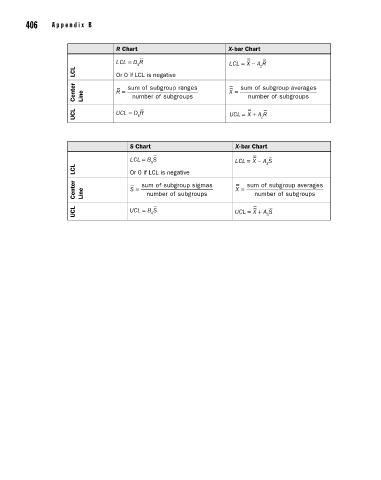
R Chart X- bar Chart
LCL = D R LCL = X −
3 A R
2
LCL Or 0 if LCL is negative
Center Line R = sum of subgroup ranges X = sum of subgroup averages
p
number of subgroups
number of subgroups
UCL UCL = D R UCL = X + A R
4
2
S Chart X- bar Chart
LCL = B S LCL = X −
3 A S
3
LCL Or 0 if LCL is negative
Center Line S = sum of subgroup sigmas X = sum of subgroup averages
number of subgroups
number of subgroups
p
UCL UCL = B S UCL = X + A S
4
3
21_Pyzdek_AppB_Ch21_p403-406.indd 406 11/9/12 5:32 PM