
Page 418 - The Handbook for Quality Management a Complete Guide to Operational Excellence
P. 418
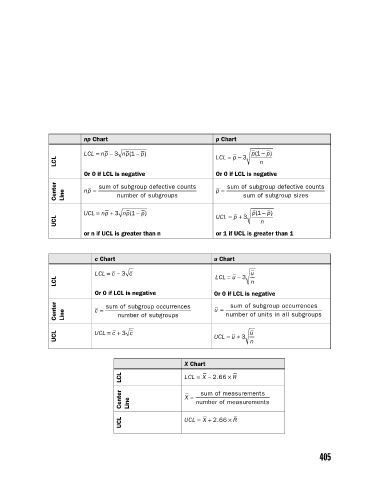
np Chart                             p Chart
                               LCL =  np − 3  np 1 −  p)            LCL =  p − 3  p 1 −  p)
                                                                              (
                                            (
                        LCL                                                     n
                               Or 0 if LCL is negative              Or 0 if LCL is negative
                        Center   Line  np =  sum of subgroup defective counts  p =  sum of subgroup defective counts
                                                                                   b
                                                                           sum of subgroup sizes
                                                f
                                        number of subgroups
                               UCL =  np + 3  np 1  −  p)           UCL =  p + 3  p 1 −  p)
                                            (
                                                                               (
                        UCL                                                     n
                               or n if UCL is greater than n        or 1 if UCL is greater than 1
                                  c Chart                          u Chart

                                  LCL =  c − 3  c                   LCL =  u − 3  u
                        LCL                                                  n
                                  Or 0 if LCL is negative          Or 0 if LCL is negative
                        Center   Line  c =  sum of subgroup occurrences  u =  number of units in all subgroups
                                                                        sum of subgroup occurrences
                                                                                  s
                                         number of subgroups
                                                     r
                        UCL       UCL =  c + 3  c                  UCL =  u + 3  u n


                                                           X Chart
                                          LCL              LCL =  X − 2 66  ×  R
                                                                    .
                                          Center   Line    X =  number of measurements
                                                               sum of measurements


                                                                    .
                                          UCL              UCL =  X + 2 66  ×  R


                                                                                                405


          21_Pyzdek_AppB_Ch21_p403-406.indd   405                                                       11/9/12   5:32 PM