
Page 131 - The Master Handbook Of Acoustics
P. 131
106 CHAPTER FIVE
Typical classical Percussive
symphony classical
Close
Close mic
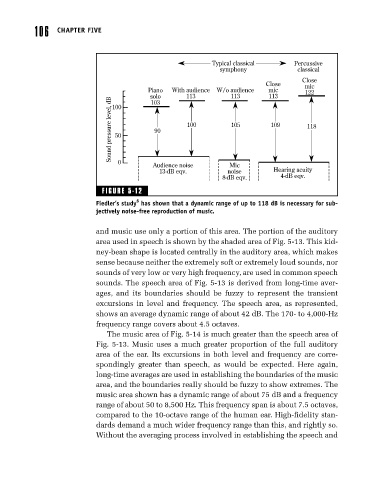
Piano With audience W/o audience mic 122
solo 113 113 113
Sound pressure level, dB 50 90 100 105 109 118
103
100
0
Audience noise Mic
13-dB eqv. noise Hearing acuity
8-dB eqv. 4-dB eqv.
FIGURE 5-12
6
Fiedler’s study has shown that a dynamic range of up to 118 dB is necessary for sub-
jectively noise-free reproduction of music.
and music use only a portion of this area. The portion of the auditory
area used in speech is shown by the shaded area of Fig. 5-13. This kid-
ney-bean shape is located centrally in the auditory area, which makes
sense because neither the extremely soft or extremely loud sounds, nor
sounds of very low or very high frequency, are used in common speech
sounds. The speech area of Fig. 5-13 is derived from long-time aver-
ages, and its boundaries should be fuzzy to represent the transient
excursions in level and frequency. The speech area, as represented,
shows an average dynamic range of about 42 dB. The 170- to 4,000-Hz
frequency range covers about 4.5 octaves.
The music area of Fig. 5-14 is much greater than the speech area of
Fig. 5-13. Music uses a much greater proportion of the full auditory
area of the ear. Its excursions in both level and frequency are corre-
spondingly greater than speech, as would be expected. Here again,
long-time averages are used in establishing the boundaries of the music
area, and the boundaries really should be fuzzy to show extremes. The
music area shown has a dynamic range of about 75 dB and a frequency
range of about 50 to 8,500 Hz. This frequency span is about 7.5 octaves,
compared to the 10-octave range of the human ear. High-fidelity stan-
dards demand a much wider frequency range than this, and rightly so.
Without the averaging process involved in establishing the speech and