
Page 169 - The Master Handbook Of Acoustics
P. 169
144 CHAPTER SEVEN
Writing speed-millimeters/second
200 315 500 800 1000
0
Relative sound pressure level, dB 20
10
30
40
50
FIGURE 7-9
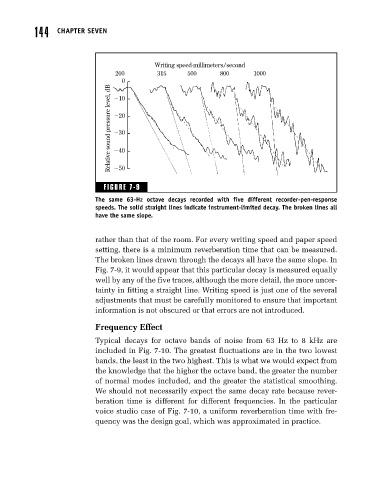
The same 63-Hz octave decays recorded with five different recorder-pen-response
speeds. The solid straight lines indicate instrument-limited decay. The broken lines all
have the same slope.
rather than that of the room. For every writing speed and paper speed
setting, there is a minimum reverberation time that can be measured.
The broken lines drawn through the decays all have the same slope. In
Fig. 7-9, it would appear that this particular decay is measured equally
well by any of the five traces, although the more detail, the more uncer-
tainty in fitting a straight line. Writing speed is just one of the several
adjustments that must be carefully monitored to ensure that important
information is not obscured or that errors are not introduced.
Frequency Effect
Typical decays for octave bands of noise from 63 Hz to 8 kHz are
included in Fig. 7-10. The greatest fluctuations are in the two lowest
bands, the least in the two highest. This is what we would expect from
the knowledge that the higher the octave band, the greater the number
of normal modes included, and the greater the statistical smoothing.
We should not necessarily expect the same decay rate because rever-
beration time is different for different frequencies. In the particular
voice studio case of Fig. 7-10, a uniform reverberation time with fre-
quency was the design goal, which was approximated in practice.