
Page 167 - The Master Handbook Of Acoustics
P. 167
142 CHAPTER SEVEN
Mode Decay Variations
To make this discussion more meaningful, real-life measurements in a
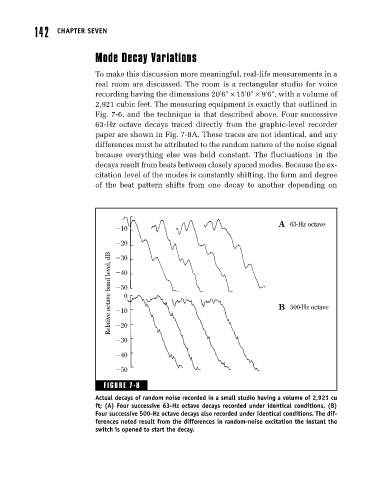
real room are discussed. The room is a rectangular studio for voice
recording having the dimensions 20'6" × 15'0" × 9'6", with a volume of
2,921 cubic feet. The measuring equipment is exactly that outlined in
Fig. 7-6, and the technique is that described above. Four successive
63-Hz octave decays traced directly from the graphic-level recorder
paper are shown in Fig. 7-8A. These traces are not identical, and any
differences must be attributed to the random nature of the noise signal
because everything else was held constant. The fluctuations in the
decays result from beats between closely spaced modes. Because the ex-
citation level of the modes is constantly shifting, the form and degree
of the beat pattern shifts from one decay to another depending on
A 63-Hz octave
10
20
Relative octave band level, dB 40 B 500-Hz octave
30
50
0
10
20
30
40
50
FIGURE 7-8
Actual decays of random noise recorded in a small studio having a volume of 2,921 cu
ft; (A) Four successive 63-Hz octave decays recorded under identical conditions. (B)
Four successive 500-Hz octave decays also recorded under identical conditions. The dif-
ferences noted result from the differences in random-noise excitation the instant the
switch is opened to start the decay.